System monitor
Note
The system monitor functionality requires that the Data Collector service is running and only works on computers that use a Gregorian (Western) calendar.
System monitor dashboard
By default, the system displays tiles that represent all Recording servers, All servers, and All cameras. You can customize the monitoring parameters of these default tiles and create new tiles. For example, you can set up tiles to represent a single server, a single camera, a group of cameras, or a server group.
Monitoring parameters are, for example, CPU usage or memory available for a server. A tile monitors only the monitoring parameters you have added to the tile. See Add a new camera or server tile, Edit a camera or server tile, and Delete a camera or server tile for more information.
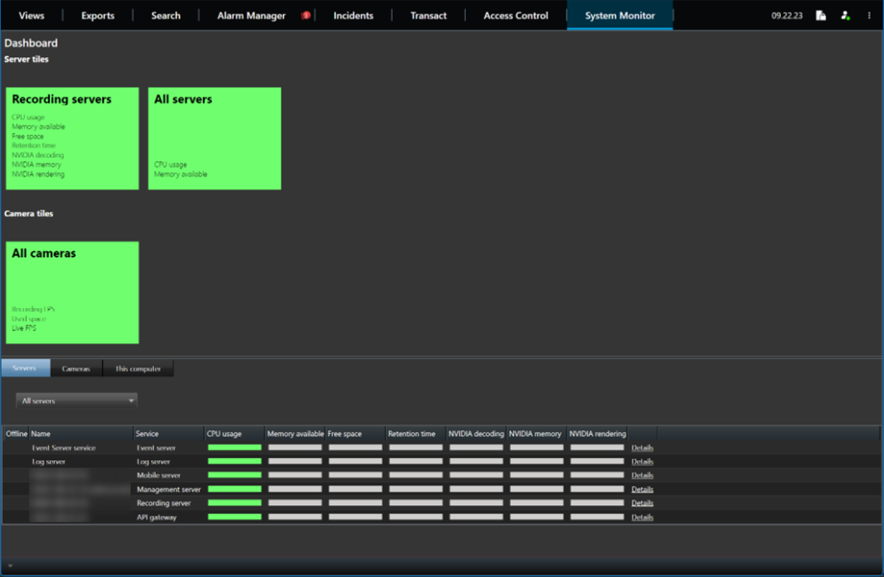
A system monitor dashboard shows the health of the different components in your VMS.
System monitor thresholds
The system has default threshold values for all hardware of the same type so that you can start monitoring the state of your system hardware from the moment your system is installed and you have added hardware. You can also set up threshold values for individual servers, cameras, disks, and storage. To change threshold values, see Edit thresholds for when hardware states should change.
To ensure that you do not see a Critical or Warning state in cases where the usage of or the load on your system hardware reaches a high threshold value only for a second or similar, use Calculation interval. With the correct calculation interval setting, you will not receive false-positive alerts about exceeded thresholds but only alerts about sustained issues with, for example, CPU usage or memory consumption.
You can also set up rules to perform specific actions or activate alarms when a threshold changes from one state to another.