Visual Layers
The Visual Layers control ( ) provides users with visibility into statistical visual analysis of object activity and dwell areas and popular event paths in a synopsis.
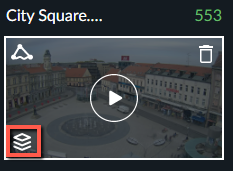
The visual layers are available for viewing only after synopsis processing is complete. Clicking the control opens the VIDEO SYNOPSIS® and there are four icons at the bottom left of the screen for each of the visual layers (as shown in image below).
Visual layers can be created per specific search criteria. For example, when a user refines the search and filters for bicycle, the generated visual layer will be created according to the filtered objects.
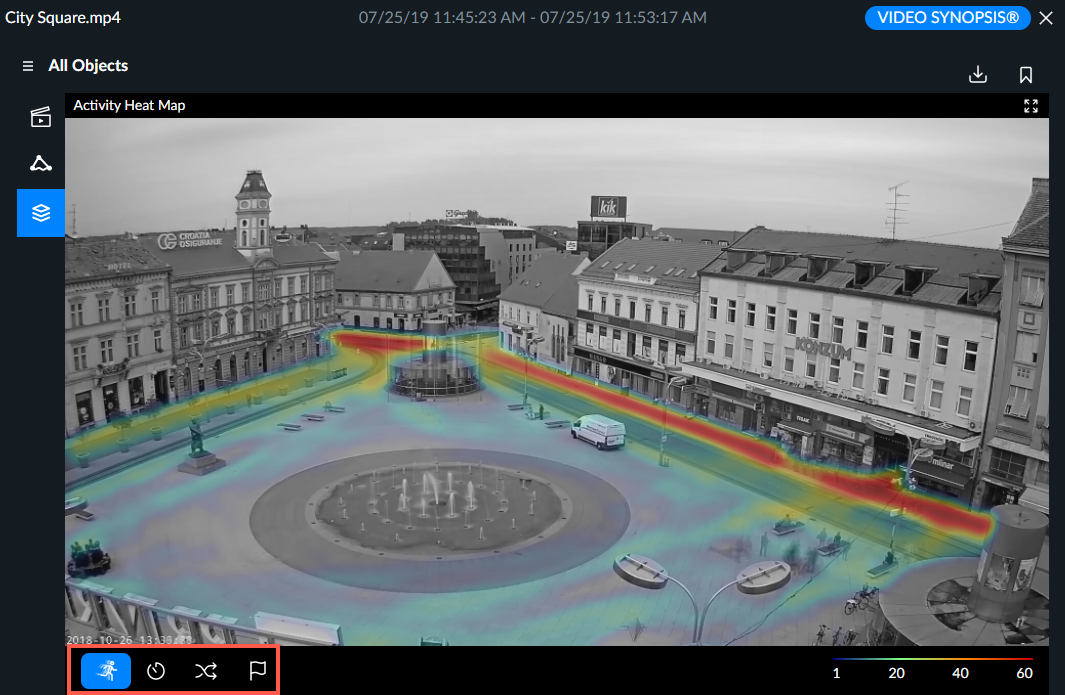
For each visual layer, clicking the close icon ( ) closes the visual layer and resumes the event thumbnail view.
You can also click the full screen icon ( ) from any of the visual layers.
See also:
Adding a Visual Layer to a Report or Exporting an Image
Displaying a Specific Visual Layer in the RESEARCH solution