Maps (usage)
If you are connected to a surveillance system that supports Milestone Federated Architecture, you can only add maps from the surveillance system server you logged in to.
Maps (explained)
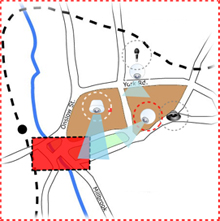
With a map, you get a physical overview of your surveillance system. You can instantly see which cameras are placed where, and in what direction they are pointing. You can use maps for navigation. Maps can be grouped into hierarchies, so you can drill down through hot zones, from large perspectives to detailed perspectives, for example, from city level to street level, or from building level to room level.
A map position does not display live video, a map is always a still image.
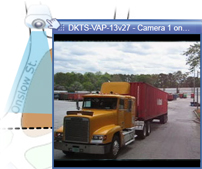
Maps may contain elements representing cameras, microphones, and similar technology. You can view recorded video from cameras in a preview window when you move your mouse over a camera icon on the map. The status information in playback mode is not based on recorded data, but retrieved from the elements' current status, as displayed in live mode.
Map with camera elements and hot zone
Maps do not have to be geographical maps, although they often are. Depending on your organization's needs, photos and other kinds of image files can also be used as maps.
Maps are not the same as a smart map. For more information, see Differences between maps and smart maps (explained).
How elements interact with maps
You can use map elements to interact with the actual devices in the following ways:
Place your mouse pointer over a camera on a map to see a live preview from the camera. Click the title bar of the preview to display it as a separate floating window. You can resize the floating window by pulling its corners. To start recording, right-click the required camera and select Start recording for # minutes. Particular user rights may be required to use this feature.
A fixed camera is displayed on the map with an associated view zone that shows the camera's angle of view. Note that the angle on the map is very likely to need adjustment to match the camera's angle of view. To adjust the angle, simply drag it to a suitable size and position.
A PTZ camera is displayed on the map with any PTZ presets defined for the camera on the surveillance system. The presets are illustrated as colored angles that radiate from the PTZ camera icon. Each angle represents a particular preset. Note that the angles are very likely to need adjustment to match the camera's preset angles. To adjust an angle, simply drag it to a suitable size and position. If a camera has more than 25 presets, no angles are initially displayed since the angles would be too small to be useful. In such cases, you can add required angles individually by dragging the presets from the required camera from the Element selector window onto the map. To go to one of a PTZ camera's presets, simply click the preset on the map. This works in the floating preview window, on the map itself, as well as in hotspot positions (see Hotspots (explained)). Alternatively, right-click the camera, select PTZ presets, then select the required preset.
Place your mouse over a microphone; press and hold the left mouse button to listen to incoming audio from a microphone, or right-click the microphone and select Listen to microphone. You cannot use microphones in map views in playback mode.
Place your mouse over a speaker; press and hold the left mouse button to talk through the speaker. You cannot use speakers in map views in playback mode.
Click an event on the map (see Alarms (explained)) to activate it, or right-click the event and select Activate event. When left-clicking an event, the mouse pointer briefly changes to a lightning symbol to indicate that the event is being activated.
Click an alarm on the map (see Alarms (explained)) to view it, or right-click the alarm and select Activate Alarm. Right-click to acknowledge the alarm.
Click an output on the map to activate it, or right-click the output and select Activate output. When you click an output, the mouse pointer briefly changes to a lightning symbol to indicate that the output is being activated.
A hot zone is usually colored, so it is easy to recognize. Click a hot zone to go to the sub-map associated with the hot zone, or right-click the required hot zone and select Go to sub-map.
If the hot zone appears with a dotted outline, no map is associated with the hot zone.
On some surveillance systems, maps from several different servers may be in a map hierarchy. This can mean that when you click a hot zone, the sub-map is unavailable because its server is unavailable. Servers can become unavailable because of scheduled maintenance or network problems. Contact your system administrator if the problem persists.
A hot zone can point to a map that you do not have access rights to and the XProtect Smart Client will inform you about this. Because user rights can be time-based, you might not be able to access a map that you could previously. This can be because you do not have access during certain hours of the day or certain days of the week. Contact your system administrator if in doubt about your user rights.
Plug-in elements are available only if used on your surveillance system. Examples of plug-in elements: access control systems, fire detection systems, etc.
Because interconnected hardware that is part of a Milestone Interconnect system is offline at times, you may often see error statuses on the interconnected hardware element on a map.
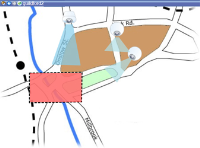
Status visualization is a feature that graphically displays the status of elements added to a map. When a map is fully operational and in the normal state, no visual status indication is presented. The Status visualization window lets you define the visual appearance of maps' status indication.
|
Indicator |
Description |
|---|---|
|
|
Attention needed - when an element requires attention, but is still working; for instance when a server is running out of disk space. Note that the device in question is not necessarily included on the map. The default display color is yellow. |
|
|
Not operational - when there is an error on the element, for example if a server cannot connect to a microphone or speaker. The default display color is orange. |
|
|
Alarms - when an element has an alarm attached to it. The default display color is red. |
|
|
Disabled/status unknown - when an element has been disabled on the surveillance server, or when it is not possible to obtain status information from a server. The default color is purple. |
|
|
Ignore status - when an element has a status that does not need attention, for example, if you are already aware of what the issue is. The default color is blue. |
The status of a map mirrors the status of all elements on the map. Up to four names of affected servers can be listed in the map title bar. In cases where an unavailable server causes disabled elements on the map, but the server itself is not included on the map, the map is displayed in the not operational state, even though the map only contains disabled elements. If the unavailable server is included on the map, the map is simply displayed with the disabled/status unknown. Status information is also available in the Map overview.

Example of map with status visualization
Change the appearance of status visualizationMap overview window (explained)
The Map overview window provides you with an overview of the map hierarchy set up in the XProtect Smart Client. To open the Map overview window, right-click the map and select Map overview or click the icon  on the map title bar.
A plus sign (+) next to a map indicates that the map could have one or more sub-maps attached to it as hot zones. Clicking a map in the Map overview immediately displays the selected map in the view.
Content in the Map overview may take some time to load if you are connected to a very large surveillance system with many maps.
If you are connected to a surveillance system that supports Milestone Federated Architecture, you can only add maps from the surveillance system server you logged in to. Milestone Federated Architecture is a system setup with related but physically separate surveillance systems. Such a setup can be relevant for, for example, chains of shops with many separate—but related—surveillance systems.
See the XProtect Comparison Chart on https://www.milestonesys.com/ for information about which surveillance systems support Milestone Federated Architecture.
Send cameras from a map to a floating window
To view all the cameras (a maximum of 25 in one view) on a map simultaneously in a floating window:
- On the Live tab or the Playback tab, select the map that contains the cameras you want to view in a floating window.
- At the top of the map title bar, click the Send all cameras to floating window icon:
 .
.
The floating window displays a maximum of 25 cameras in the view.
If you have more than 25 cameras on a map, when you click this button, it will not always be the same cameras you see.
View recorded video from cameras on a map
You can view recorded video from cameras in a preview window when you move your mouse over a camera icon on the map. The status information in playback mode is retrieved from the camera's current live status.
- You can use digital zoom and PTZ controls from the camera preview if the camera supports this. In the preview window, either click the More button and select digital zoom or use the PTZ (see PTZ images (explained)) controls that appear. If you have PTZ presets set up for a particular camera, you can activate the preset by selecting the preset in the preview
- To view all the cameras (a maximum of 25 in one view) on a map simultaneously in a floating window, click the Send all cameras to floating window icon at the top of the map title bar:

If you have more than 25 cameras on a map, when you click this button it will not always be the same cameras you see.
View status details
Status details are available for cameras (for example, resolution, image size, and bit-rate) and servers (for example, CPU usage, memory, network usage).
- To display status details, right-click the required element and select Status details. Status details are displayed in a separate, floating window
If you see the error message "Event Server has insufficient access rights to the recording servers," you will not be able to view status details from recording servers. The error message relates to the Event Server service, which handles map-related communication on the surveillance system. The Event Server service is managed on the surveillance system server. Contact your system administrator, who will be able to handle the issue.
Zoom and auto maximize
If the map is larger than the view area in the XProtect Smart Client, or if you have zoomed in on the map, you can pan the map to see otherwise hidden areas. Click the map anywhere outside of added elements, and the map centers on the clicked spot. Pan the map by clicking and dragging the map in any direction.
- To use the zoom function on a map, right-click the map and select Zoom in or Zoom out as required. Or use the Zoom to standard size function to zoom back to normal size
Alternatively, use your mouse's scroll wheel to zoom; scroll up to zoom in, scroll down to zoom out.
If Auto maximize map is enabled and your map position in the view is part of a view with several view positions, the map is automatically maximized to full screen after a period of time as defined in setup mode in the Properties pane. To revert to the original view, double-click the map anywhere outside of any added elements.


