

Site Navigation: System dashboard
This article describes how to monitor your system including how to create reports and protect data.
System dashboard (explained)
System dashboard provides you with the functionality to monitor your system and its components.
Access the following functionality:
|
Name |
Description |
|---|---|
| System Monitor |
Monitor the status of your servers and cameras by parameters you define. |
| System Monitor Thresholds |
Set threshold values for monitored parameters on server and monitor tiles used in System Monitor. |
| Evidence Lock |
Get an overview of all protected data in the system. |
| Current Task |
Get an overview of ongoing tasks on a selected recording server. |
| Configuration Reports |
Decide what to include in your system configuration reports before printing. |
System monitor (explained)
System monitor provides you with a quick, visual overview of the current state of your system's servers and cameras through colored tiles that represent the system hardware. By default, the system displays tiles that represent all Recording servers, All servers and All cameras.
The color of the tiles:
|
Tile color |
Description |
|---|---|
| Green |
Normal state. Everything is running normally. |
| Yellow |
Warning state. One or more monitoring parameters is above the threshold value (see System monitor thresholds (explained)) for the Normal state. |
| Red |
Critical state. One or more monitoring parameters is above the threshold value for the Normal and Warning state. |
You can customize the server and camera tiles if you want to display more or less tiles on the dashboard. For example, you can set up tiles to represent a single server, a single camera, a group of cameras, or a server group. You can also delete a tile if you do not want to use it or edit its monitoring parameters. Monitoring parameters are, for example, CPU usage or memory available for a server. If you remove these parameters from the server tile, the tile does not monitor these parameters on the relevant tile. Click Customize in the upper right corner of the tab to open the Customize dashboard window. See Customize dashboard for more information.
Tiles change their state and thereby color based on threshold values set in System monitor thresholds. While the system does set some default threshold values for you, you can decide for yourself what the threshold value should be for each of the three states. To set up or change threshold values, you can use System monitor thresholds. See System monitor thresholds (explained).
If a tile changes color and you want to know which server/parameter that makes the tile change color, click the tile. This opens an overview in the bottom of the screen which shows the colors red, yellow or green for each monitoring parameter you have enabled for your tile. Click the Details button to get more detailed information about why the state has changed.
If you see a warning sign and place your mouse above it, the system shows you an error message.
The system monitor functionality requires that the Data Collector service is running.
The system monitor functionality only works on computers that uses a Gregorian (Western) calendar.
Customize dashboard
Add a new camera or server tile:
- In the System monitor window, click Customize.
- In the Customize dashboard window that opens, click New under Server tiles or Camera tiles.
- In the New server tile/New camera tile window, select the cameras or servers to monitor.
- Under Monitoring parameters, select or clear check boxes for any parameters to add or remove from the relevant tile.
- Click OK. The new server or camera tile is now added to the tiles displayed on your dashboard.
Edit monitoring parameters:
- In the System monitor dashboard window, click Customize.
- In the Customize dashboard window that opens, click Edit under Server tiles or Camera tiles.
- In the Edit server tile or Edit camera tile window, select the server component or cameras you want to edit.
- In the Monitoring parameters box, select or clear the check boxes for the monitoring parameters you want to add or remove from the relevant tile.
- Click OK. The changed monitoring parameters are now a part of or removed from the relevant tile.
You can enable and disable historical data on the system if you want to. If you disable this data, you cannot see graphs of previous system behavior. If you want to reduce the load on the SQL Server and database or on your bandwidth, you can reduce the sampling interval of historical data. If you reduce the sampling interval of historical data, less details are available in graphs.
System monitor details (explained)
If you click a server or camera tile, you can see the status of each selected monitoring parameter below the dashboard.

The State field shows the camera's state. For example, a red warning is shown if the connection to the device is broken. The icon includes a tooltip with a short description of the issue that is causing the warning.
The Used space field shows data from other recording servers where this device has recordings if, for example, the device has been located on other recording servers previously.
If you click the Details button for the relevant camera/server, you can view system information and create reports regarding:
|
Component |
Description |
|---|---|
| Management server |
Shows data from the selected management server |
| Recording server(s) |
Shows data from the selected recording server. You can view these per:
|
| Failover recording servers |
Shows data from the selected failover recording server. |
| Additional servers |
Shows data on log server, event servers and more. |
| Cameras |
Shows data from any camera in any camera group in your setup. |
Each of these elements is an area you can click and expand. When you click this area, it provides relevant dynamic data on this server or camera.
The Cameras bar contains a list of camera groups to select from. Once you select a group, select a specific camera and see dynamic data for it. All servers display CPU usage and available memory information. Recording servers also display connection status information. Within each view, find a History link. Click it to view historic data and reports (to view reports on a camera, click the name of the camera). For each historic report, you can view data for the last 24 hours, 7 days or 30 days. To save and/or print reports, click the Send to PDF icon. Use the < and home icons to navigate System Monitor.
You can only create historical reports with data from the recording server where the device is currently located.
For Windows Server 2012 R2, reports can only be printed by users having administrator rights. This is caused by a limitation to the tool used for PDF creation on this specific Windows version.
If you access the system monitor's details from a server operating system, you may experience a message regarding Internet Explorer Enhanced Security Configuration. Follow the instructions in the message to add the System Monitor page to the Trusted sites zone before proceeding.
System monitor thresholds (explained)
System monitor thresholds allow you to set up and adjust the global thresholds for when tiles on System monitor should visually indicate that your system hardware changes state, for example when the CPU usage of a server changes from a normal state (green) state to a warning state (yellow).
The system is set up with default threshold values so that you can start monitoring your system hardware from the moment your system is set up. To change threshold values, see Set system monitor thresholds
As a default, the system is set up to show threshold values for all units of a particular hardware, for example all cameras or servers. You can also set up threshold values for individual servers or cameras or a subset of these. Setting threshold values for individual servers or cameras may be a good idea if, for example, some cameras should be allowed to use a higher Live FPS or Recording FPS that other cameras.
You can set the threshold values for servers, cameras, disks and storage. If you want to change threshold values, you can use the threshold control slider. The threshold control slider allows you to increase or decrease threshold values by dragging the handles separating states either up or down. The threshold control slider is divided into colors similar to those shown in your server or camera tiles present in System monitor (see System monitor thresholds (explained)).
To ensure that you do not see a Critical or Warning state in cases where the usage of or the load on your system hardware reaches a high threshold value only for a second or similar, use Calculation interval. The calculation interval feature averages out the effect of brief or frequent changes to a system hardware state. In practice, this means that the calculation interval feature evens out the effect of hardware changes over time so that you do not get alerts every time a threshold is exceeded.
For example, you can set Calculation interval to one (1) minute which ensures that you only get alerts if the average value for the whole minute exceeds the threshold. The benefit of this is that you avoid alerts about frequent and maybe possibly irrelevant changes in hardware states and only receive alerts that reflect sustained issues with, for example, CPU usage or memory consumption. To change the values of calculation intervals, see Set system monitor thresholds
Server thresholds
|
Threshold |
Description |
Unit |
|---|---|---|
| CPU usage |
Thresholds for the CPU usage on the servers you monitor. |
% |
| Memory available |
Thresholds for RAM memory in use on the servers you monitor. |
MB |
| NVIDIA decoding |
Thresholds for the NVIDIA decoding usage on the servers you monitor. |
% |
| NVIDIA memory |
Thresholds for NVIDIA RAM memory in use on the servers you monitor. |
% |
| NVIDIA rendering |
Thresholds for the NVIDIA rendering usage on the servers you monitor. |
% |
Camera thresholds
|
Threshold |
Description |
Unit |
|---|---|---|
| Live FPS |
Thresholds for cameras' FPS in use when live video is shown on cameras you monitor. |
% |
| Recording FPS |
Thresholds for cameras' FPS in use when the system is recording video on cameras you monitor. |
% |
| Used space |
Thresholds for the space used by cameras you monitor. |
GB |
Disk thresholds
|
Threshold |
Description |
Unit |
|---|---|---|
| Free space |
Thresholds for available space on disks you monitor. |
GB |
Storage thresholds
|
Threshold |
Description |
Unit |
|---|---|---|
| Retention time |
Threshold showing a prediction for when you run out of space on your storage. The state shown is based on your system setup and is updated twice a day. |
Days |
You can also set up rules (see Rules) to perform specific actions or activate alarms (see System dashboard (explained)) when a threshold changes from one state to another.
Set system monitor thresholds
- In the Site Navigation pane, select System Monitor Thresholds.
-
Select the Enable check box for the relevant hardware if you have not already enabled it. The figure below shows an example.
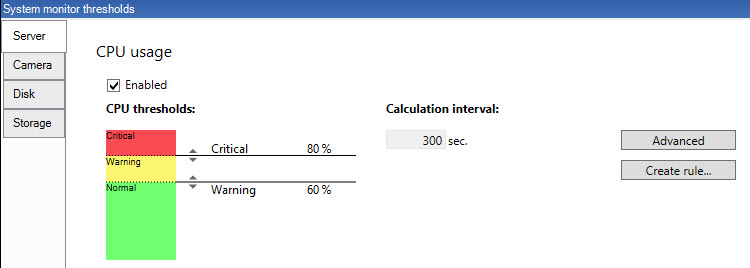
- Drag the threshold control slider up or down to increase or decrease the threshold value. There are two sliders available for each piece of hardware shown in the threshold control, separating the Normal, Warning and Critical levels.
- Enter a value for the calculation interval or keep the default value.
- If you want to set values on individual pieces of hardware, click Advanced.
- If you want to specify rules for certain events or within specific time intervals, click Create rule.
- Once you have set the relevant thresholds levels and calculation intervals, select File > Save from the menu.
Example of a threshold setting:
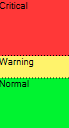
- Red indicates you have reached a Critical state
- Yellow is a Warning state indicating that you are close to reaching the Critical state
- Green indicates that things are at a normal state and within your selected threshold values
Evidence lock (explained)
Available functionality depends on the system you are using. See https://www.milestonesys.com/solutions/platform/product-index/ for more information.
As of XProtect VMS version 2020 R2, when you upgrade the management server from an earlier version, it will not be possible to create or modify evidence locks on recording servers that are version 2020 R1 or earlier, until these recording servers have been upgraded.
This also means that if hardware has been moved from one recording server (from 2020 R1 or earlier) to another recording server, and it still has recordings on it, then evidence locks cannot be created or modified.
With the evidence lock functionality, client operators can protect video sequences, including audio and other data, from deletion if required, for example, while an investigation or trial is ongoing. For information about how to lock evidence, see the XProtect Smart Client documentation.
When protected, the data cannot be deleted, neither automatically by the system after the system's default retention time or in other situations nor manually by the client users. The system or a user cannot delete the data until a user with sufficient user rights unlocks the evidence.
Flow diagram for Evidence Lock:
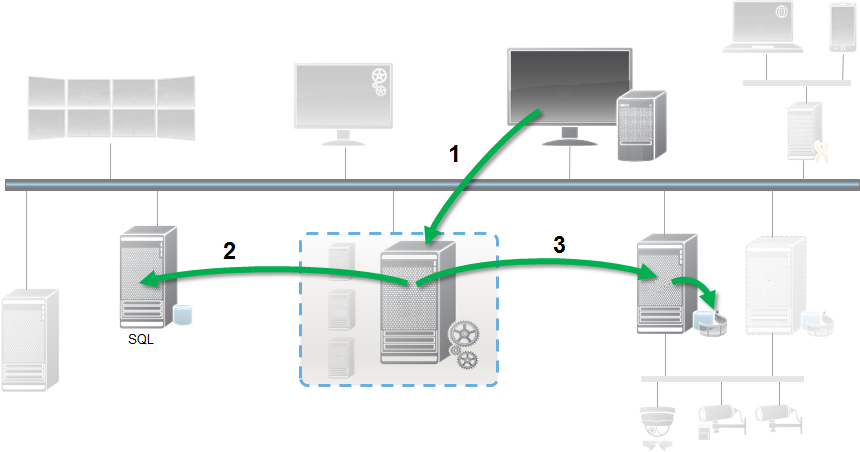
- User creates an evidence lock in XProtect Smart Client. Information sent to Management Server.
- Management Server stores information about the evidence lock in the SQL database.
- Management Server informs Recording Server to store and protect the protected recordings in the database.
When the operator creates an evidence lock, the protected data remains in the recording storage that it was recorded to, and is moved to archiving disks together with non-protected data, but the protected data:
- Follows the retention time configured for the evidence lock. Potentially infinitely
- Keeps the original quality of the recordings, even if grooming has been configured for non-protected data
When an operator creates locks, the minimum size of a sequence is the period that the database divides recorded files into, this is by default one-hour sequences. You can change this, but it requires that you customize the RecorderConfig.xml file on the recording server. If a small sequence spans two one-hour periods, the system locks the recordings in both periods.
In the audit log in the Management Client, you can see when a user creates, edits or deletes evidence locks.
When a disk runs out of disk space, it does not impact the protected data. Instead the oldest non-protected data will be deleted. If there are no more non-protected data to delete, the system stops recording. You can create rules and alarms triggered by disk full events, so you are automatically notified.
Except for more data being stored for a longer period and potentially affecting disk storage, the evidence lock feature as such does not influence system performance.
If you move hardware (see Move hardware) to another recording server:
- Recordings protected with evidence locks, remains on the old recording server following the retention time set for the evidence lock, when it was created
- The XProtect Smart Client user can still protect data with evidence locks on the recordings that were made on a camera before it was moved to another recording server. Even if you move the camera multiple times and the recordings are stored on multiple recording servers
By default, all operators have the default evidence lock profile assigned to them but no user access rights to the feature. To specify the evidence lock access rights of a role, see Device tab (roles) for role settings. To specify the evidence lock profile of a role, see the Info tab (roles) for role settings.
In the Management Client, you can edit the properties of the default evidence lock profile and create additional evidence lock profiles and assign these to the roles instead.
Evidence Lock under System Dashboard shows an overview of all protected data on the current surveillance system:
- Start and end date for the protected data
- The user who locked the evidence
- When the evidence is no longer locked
- Where the data is stored
- The size of each evidence lock
All information shown in Evidence Lock are snapshots. Press F5 to refresh.
Current tasks (explained)
The Current Tasks node shows an overview of tasks under a selected recording server, their begin time, estimated end time and progress. All information shown in Current Tasks are snapshots. You can refresh these by clicking on the Refresh button in the lower right corner of the Properties pane.
Configuration reports (explained)
When you create PDF configuration reports, you can include any possible elements of your system in the report. You can, for example, include licenses, device configuration, alarm configuration, and much more. You can also customize your font and page setup and include a customized front page.
Add a configuration report
- Expand System Dashboard and click Configuration Reports. This brings up the report configuration page.
- Select the elements that you want to include in your report.
- Optional: Click Front Page to customize your front page. In the window that appears, fill in the needed info. Select Front page as an element to include in you report, otherwise the front page you customize is not included in your report.
- Click Formatting to customize your font, page size and margins. In the window that appears, select the wanted settings.
- When you are ready to export, click Export and select a name and save location for you report.
Configure report details
The following is available when setting up reports:
|
Name |
Description |
|---|---|
| Select All |
Selects all elements in the list. |
| Clear All |
Clears all elements in the list. |
| Front Page |
Customize the front page of the report. |
| Formatting |
Format the report. |
| Export |
Select a save location for the report and create a PDF. |