Monitor the health of your customers' systems
Monitor mode displays, in full-screen, the latest error notification that Milestone Customer Dashboard received on the Errors page. This provides an at-a-glance view of the errors that have been reported by your connected servers.
From the main menu, you can open Monitor mode. When page opens, you are shown the latest status of the servers, that are reporting errors to Milestone Customer Dashboard.
-
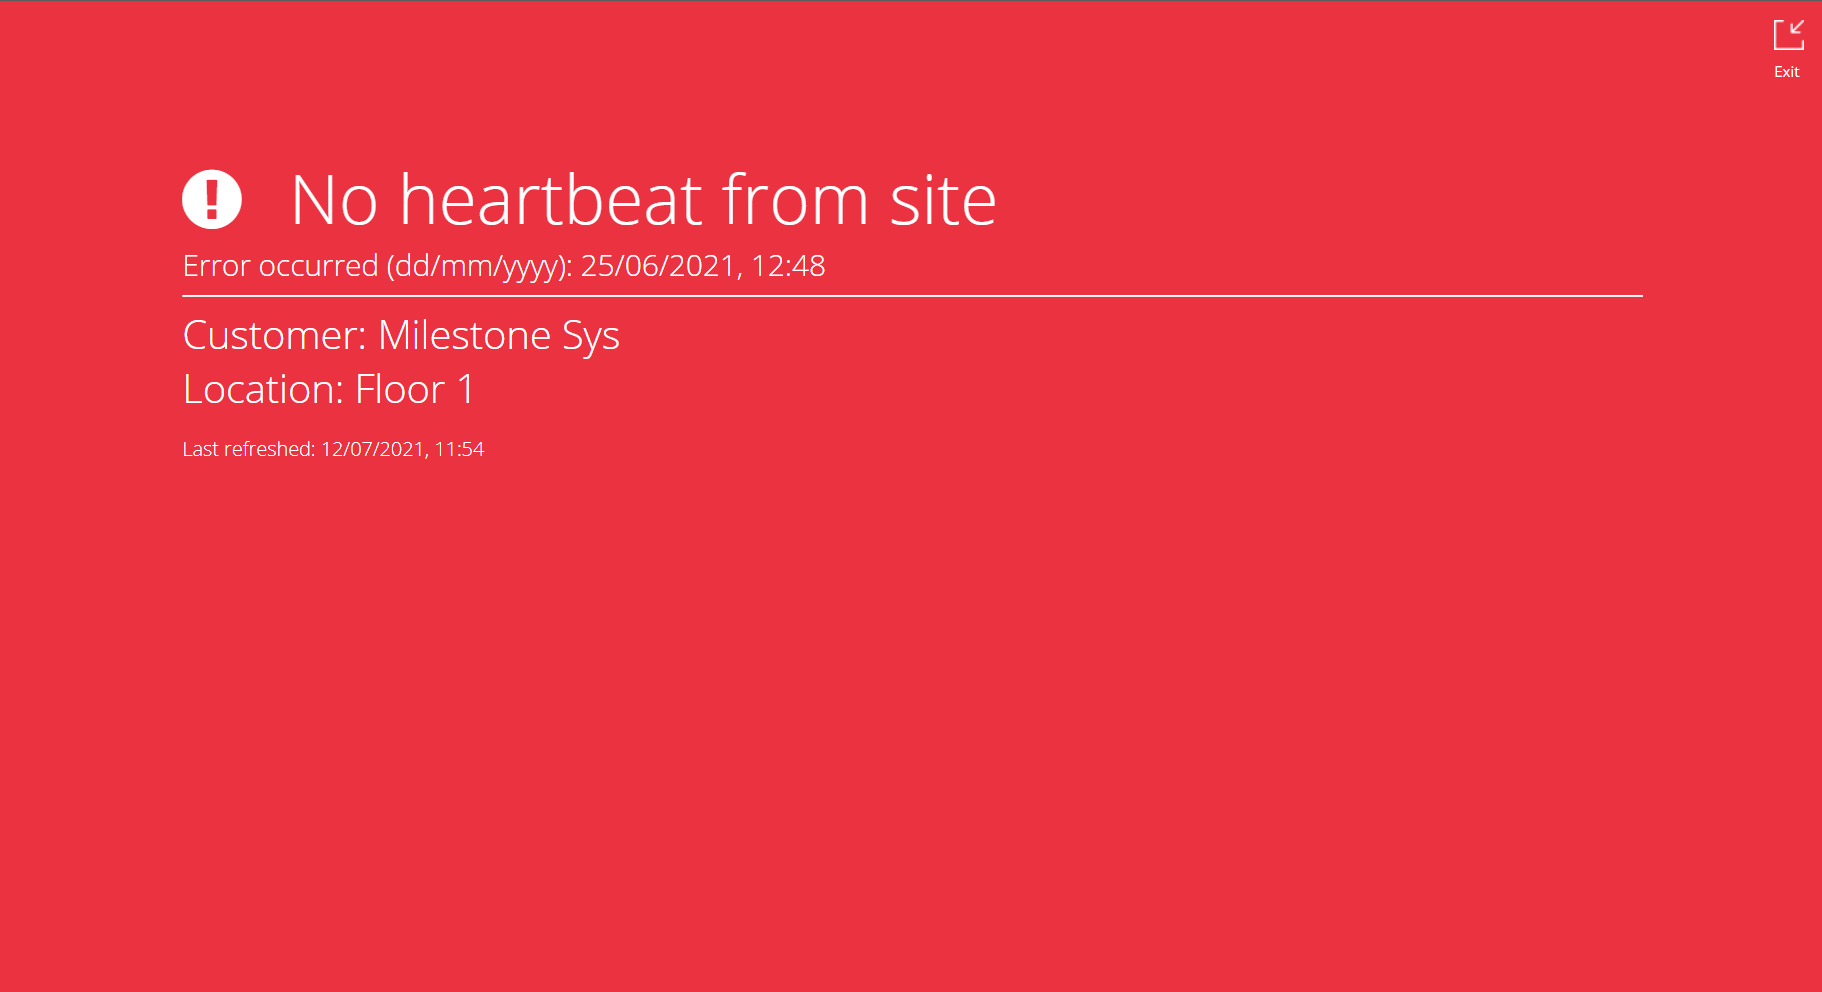
If an error is detected, the page is red. It informs you of the type of error, the date and time when the error occurred, Customer name, and Location. Example:

-
In contrast, if no errors are detected, the page is green. Example: