Useful Expressions
Below are a number of examples of expressions that you can use to customize your dashboards.
Count Expressions
Count the Number of Objects
For Aggregated dashboards | For Detailed dashboards |
|
|
Where:
Category ID | Category |
0 | People |
1 | Bicycles |
2 | Road Vehicles |
3 | Other Vehicles |
4 | Animals |
5 | Illumination Changes |
For example:
People counting for aggregated dashboards:
sum({$<[Class Category ID]={0}>}TotalObjects)People counting for detailed dashboards:
count({$<[Class Category ID]={0}>}ObjectID)
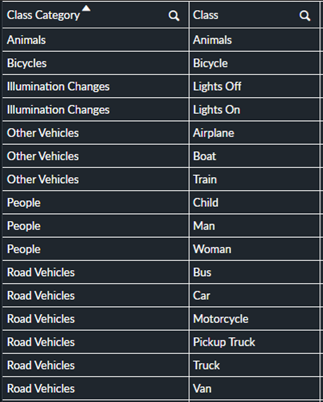
In the chart below, you can see which classes are included in each of the categories:
Count the Number of People
From 60 days ago:
For Aggregated dashboards | For Detailed dashboards |
|
|
Note that in the examples where the name Entry is used, it is given as an example of the name of a custom dimension. You can replace this with the name of any of your custom dimensions.
In an area called Entry:
For Aggregated dashboards | For Detailed dashboards |
|
|
From the previous seven days (last week) in an area called Entry:
For Aggregated dashboards | For Detailed dashboards |
|
|
From the last two weeks in an area called Entry:
For Aggregated dashboards | For Detailed dashboards |
|
|
From two weeks ago until one week ago in an area called Entry:
For Aggregated dashboards | For Detailed dashboards |
|
|
For example, if today is 20/8/2020 and the expression is run, it will count people from 6/8/2020 (>today-14) until 13/8/2020 (<today-7).
From watchlists who visited the Left Wing camera and the Exit 1 camera, but not Entrance 2 camera:
For Aggregated dashboards | For Detailed dashboards |
N/A |
|
Note that if the word DISTINCT occurs before the function arguments, duplicates resulting from the evaluation of the function arguments are disregarded.
In Camera 4 in the “Entry” path together with the number of people in Camera 15 in all paths and areas except the “Passing by” path:
For Aggregated dashboards | For Detailed dashboards |
|
|
Who are employees (based on the watchlist named Employees):
For Aggregated dashboards | For Detailed dashboards |
N/A |
|
In the “Entry” area (not including employees on the “Employees” watchlist):
For Aggregated dashboards | For Detailed dashboards |
N/A |
|
Counts objects that moved in a direction higher than 299.5 or lower than 60.5:
For Aggregated dashboards | For Detailed dashboards |
N/A |
|
Date and Time Expressions
Number of days in the current year and month with more than 1000 people:
For Aggregated dashboards | For Detailed dashboards |
|
|
Number of days in the entire time range that have more than 1000 people:
For Aggregated dashboards | For Detailed dashboards |
|
|
Time gap between last two persons in same camera and day:
This is relevant, for example, to make sure that the last two employees in the branch are not walking out together.
For Aggregated dashboards | For Detailed dashboards |
N/A |
|
10-minute increments of time between the hours of 4am and 8am:
For Aggregated dashboards | For Detailed dashboards |
N/A |
|
Automatically open a sheet to show today and the previous seven days:
In the Sheet properties, open the Action section.
From the Action property, select Select values matching search criteria.
From the Field property, select Date.
In the Value property, enter:
='>=' & Date(Today()-7) & '<=' & Date(Today())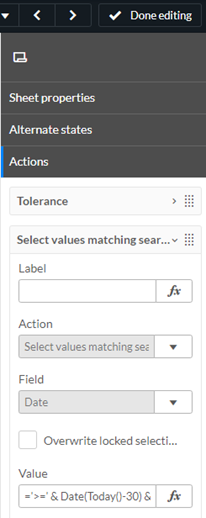
Ensure a chart starts with the proper days of the week order:
Click on the chart that includes days.
From the chart’s properties, select the Sorting section.
Select a dimension that includes Day.
Make sure the Sort by expression is checked.
Make sure the order is set to Ascending.
In the Expression property, enter the following:
match(Day, 'Mon', 'Tue', 'Wed', 'Thu', 'Fri', 'Sat', 'Sun')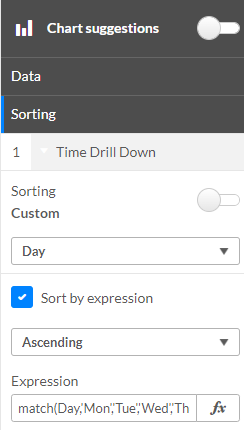
Expressions for Maximums and Minimums
Note that if the word DISTINCT occurs before the function arguments, duplicates resulting from the evaluation of the function arguments are disregarded.
Max People/Hour (multiple Path & Area)
For Aggregated dashboards | For Detailed dashboards |
|
|
Maximum number of visitors per hour on a daily basis (not including employees on the “Employees” watchlist):
For Aggregated dashboards | For Detailed dashboards |
N/A |
|
Minimum number of visitors per hour on a daily basis (not including employees on the “Employees” watchlist):
For Aggregated dashboards | For Detailed dashboards |
N/A |
|
Expressions for Averages
Average number of people per day in custom dimension named Entry:
For Aggregated dashboards | For Detailed dashboards |
|
|
Average number of people per hour in custom dimension named Entry:
For Aggregated dashboards | For Detailed dashboards |
|
|
Average number of people every 10 minutes:
For Aggregated dashboards | For Detailed dashboards |
N/A |
|
Average number of times there were 50+ people within 10 minutes:
For Aggregated dashboards | For Detailed dashboards |
N/A |
|
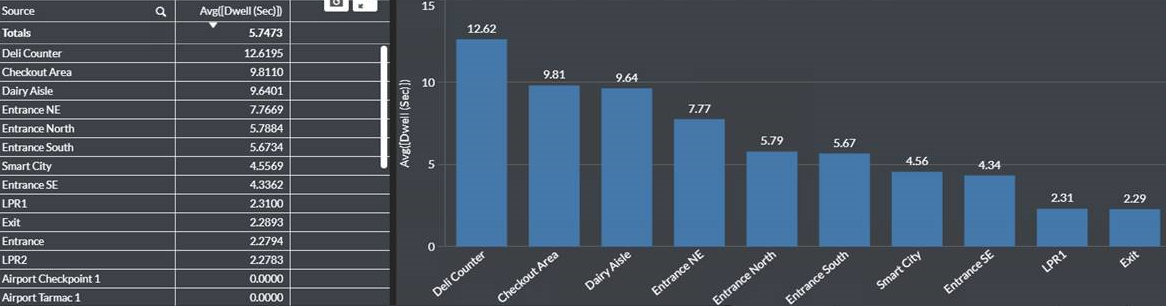
Top 10 Sources according to the longest Avg dwell time (people only), per max date:
Add a Bar chart with one of the below measure’s expressions (per your need):
Measure expression for Avg dwell time (people only), across all dates:
For Aggregated dashboards:
sum({$<[Class Category ID]={0}>}WeightedAvgDwellSec) / sum({$<[Class Category ID]={0}>}TotalObjectsFor Detailed dashboards:
Avg({$<[Class Category ID]={0}>}[Dwell (Sec)])
Measure expression for Avg dwell time (people only), per max date:
For Aggregated dashboards:
Avg({$<[Class Category ID]={0},[Date]={"$(=Max(Date))"}>}[Dwell (Sec)])For Detailed dashboards:
sum({$<[Class Category ID]={0},[Date]={"$(=Max(Date))"}>}WeightedAvgDwellSec) / sum({$<[Class Category ID]={0},[Date]={"$(=Max(Date))"}>}TotalObjects)
Change the name of the measure to Avg Dwell.
Add a Dimension and select Source.
Add a limitation on the Source Dimension to set top 10 Sources as shown in the image below.
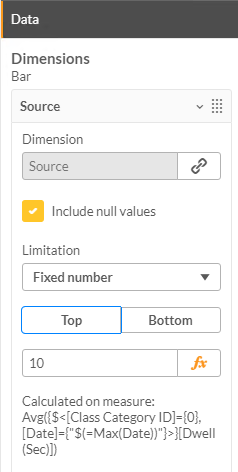
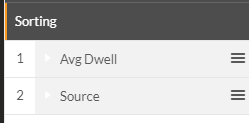
Sort the chart by the expression (by having the Avg Dwell measure as the first item in the Sorting list).
See the result:
Exclusion Expressions
Exclude specific custom dimensions:
For Aggregated dashboards | For Detailed dashboards |
|
|
Exclude weekends for ‘On-Demand’ Mon-Fri scheduling.
For Aggregated dashboards | For Detailed dashboards |
|
|
Note
To remove gender from graphs, replace vClass with vClassCategory.
Vehicle Expressions
Bicycle Counting – Counts bicycles only:
For Aggregated dashboards | For Detailed dashboards |
|
|
Road Vehicle Counting – Counts the following classes: Bus, Car, Motorcycle, Pickup Truck, Truck, and Van:
For Aggregated dashboards | For Detailed dashboards |
|
|
Other Vehicle Counting – Counts the following classes: Airplane, Boat, and Train:
For Aggregated dashboards | For Detailed dashboards |
|
|
Vehicle U-turn counts from the previous 7 days:
For Aggregated dashboards | For Detailed dashboards |
|
|
Vehicle U-turns per hour:
For Aggregated dashboards | For Detailed dashboards |
|
|
Duration for date per LPR:
For Aggregated dashboards | For Detailed dashboards |
N/A |
|