Dashboards
BriefCam includes a library of dashboards available out-of-the-box with the RESEARCH solution for quick and easy onboarding.
Note
When using a multi-site deployment (comprised of multiple site systems and a central Hub), dashboards are not available in Site deployments.
Only users belonging to the Research-Editors or Research-Viewers groups are allowed to access the RESEARCH solution’s DASHBOARDS tab. The administrator can add users to groups.
RESEARCH Home Screen
When you click the RESEARCH tab, you’ll see the RESEARCH Home screen, which allows you to switch between different versions of the home page tailored for specific use cases, including Customer Experience, Operations, Safe City, and Transportation. On this screen you will also find common key metrics, the active cameras, and the links to dashboards relevant to each use case.
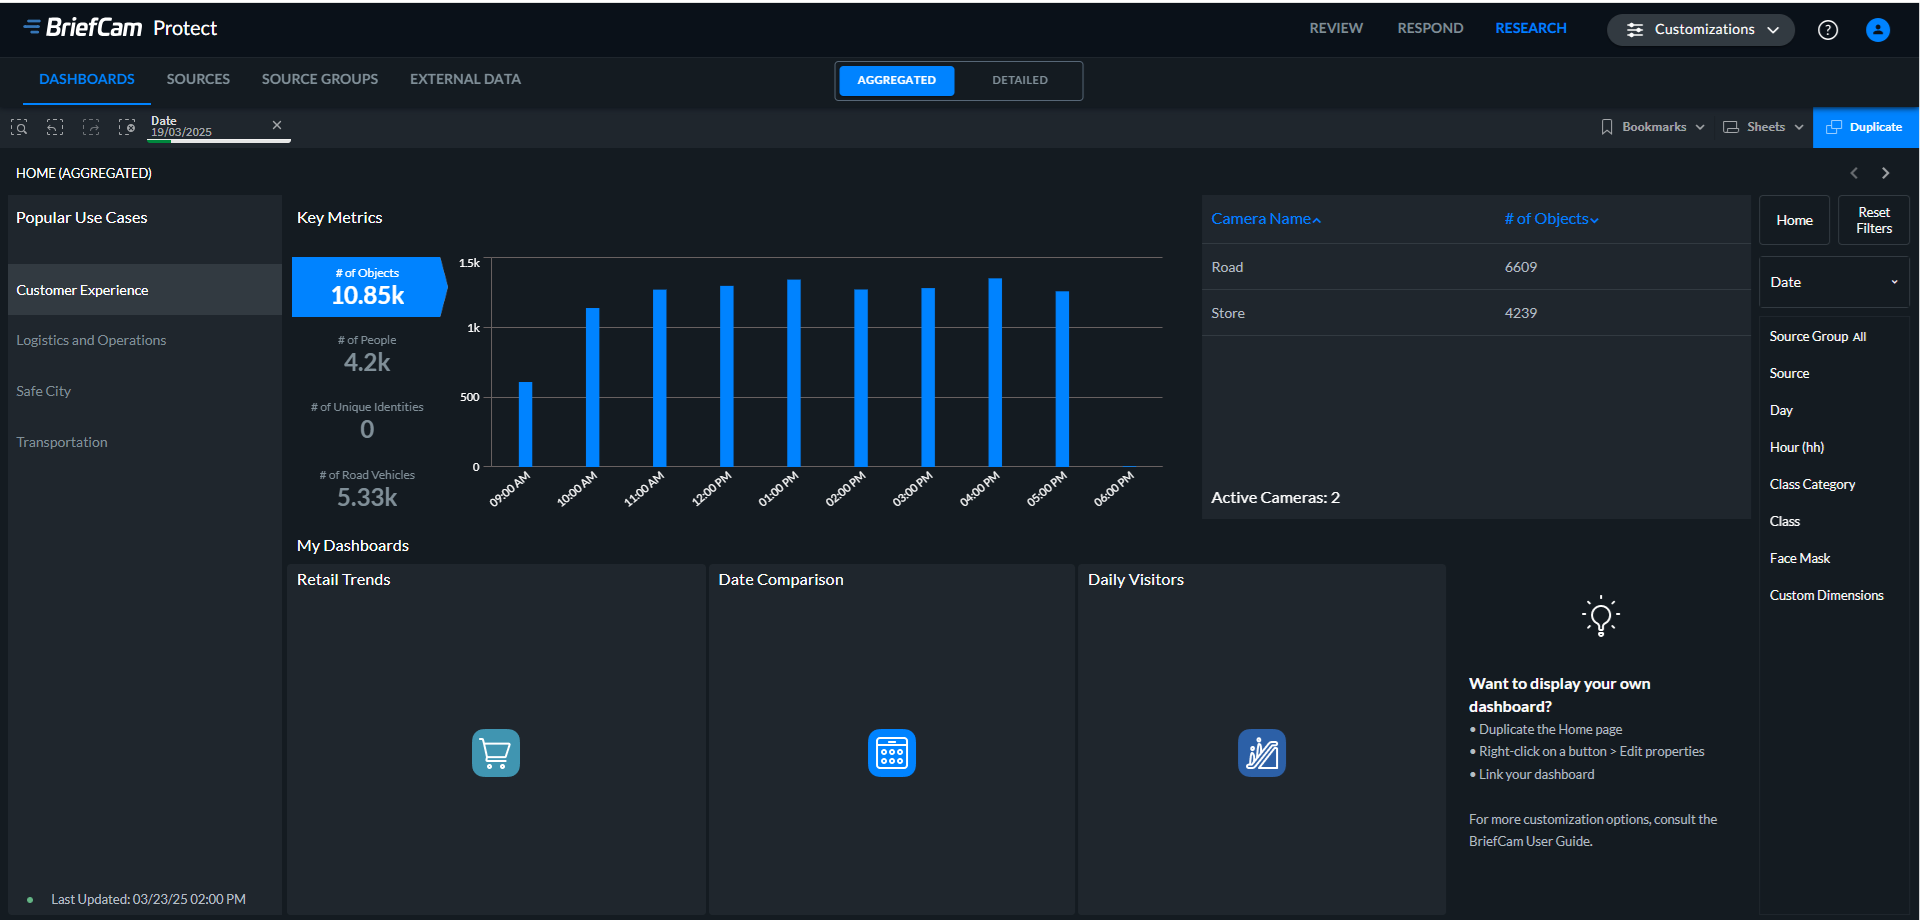
Research-Editors can add customized dashboards as described in the Changing the Dashboards on the Home Screen section and can edit the Home screen similar to any other dashboard. For additional information, see the Creating Your Own Analytics section.
Administrators can set a default use case.
Note
For Arabic, Czech, Danish, Finnish, Hebrew, Thai, Ukrainian, and Vietnamese, the translation is partial in RESEARCH dashboards. (The UI is not translated, but internal values are translated.) The translation of RESEARCH dashboards is not available for Bulgarian and Russian.
Aggregated and Detailed Dashboards
RESEARCH data is set in two models:
Aggregated (summary) – A summarized hour-level data model that aggregates the data of all the objects that were captured in each hour. This data model can be used for longer retention periods (years). This model significantly reduces storage consumption, enabling longer retention periods—spanning years—while simultaneously optimizing RAM usage. As a result, it also reduces overall hardware costs, making it a more cost-effective and scalable solution for long-term data storage and analysis.
Detailed – A complete data model that includes all the objects and their details. This data model is designed to support short retention periods (up to a month).
You will see two options at the top center of the screen where you can toggle between the AGGREGATED and DETAILED dashboards.

Data about the following is not included in the Aggregated mode: Proximity, License Plate Recognition, Color, Size, and Speed. The minimal Tolerance level for the Aggregated mode is Normal tolerance.
Note that the Detailed Home page may include a different set of dashboards.
Filters
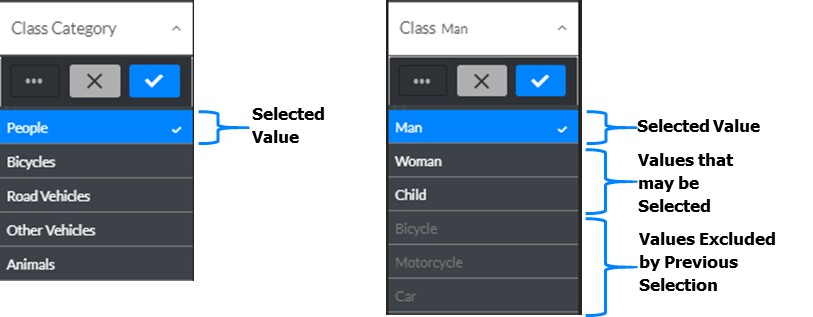
Filter Selection States
When you make selections, the colors of selection fields and their values change according to whether fields are selected or excluded and what values can be selected for them. For example, when selecting People in the Class Category filter, the values shown below will appear in the Class filter.
Filter Expression Search
You can use expressions to perform searches and make selections in filter panes and selectable items. Search expressions are evaluated for each field value in the search field (see example below).
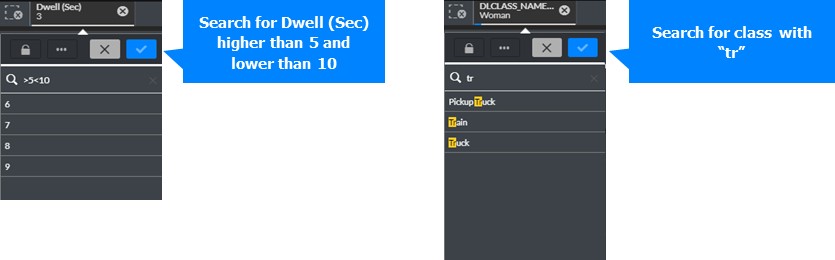
Chart Filters
There are different ways to select filters in charts. To confirm a selection, click  outside the visualization or press Enter; to cancel a selection, click
  or press Esc.
Click Selection
You can select or deselect bars by clicking them one at a time.
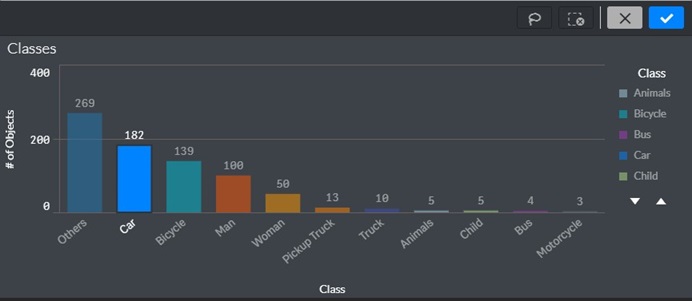
Legend Selection
You can also select and deselect legend items one at a time by clicking them.
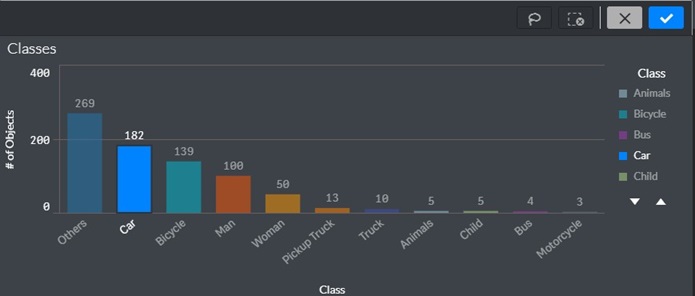
Draw Selections
You can alternatively select bars by drawing one or more lines in the chart as follows:
Click inside the visualization.
Click the lasso selection tool.
Draw a freehand line to select several values/data points at a time.
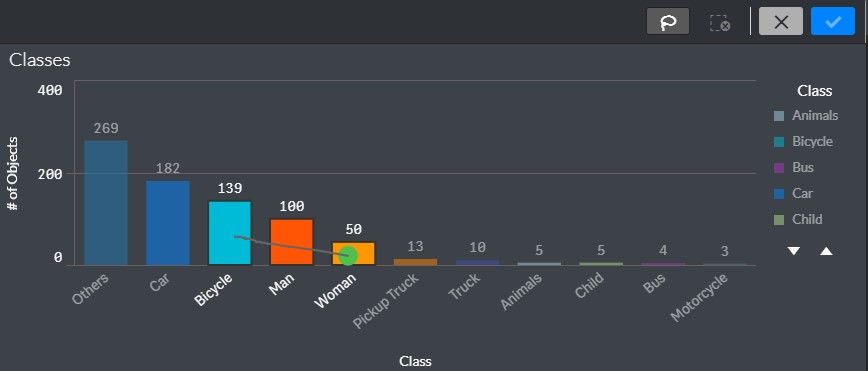
Range Selection
Make selections on either the x or y axis as follows:
Click inside the visualization.
Draw your selections on the desired axis.
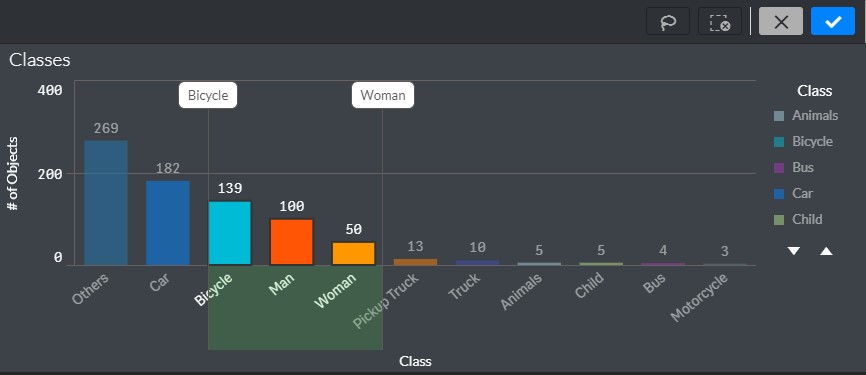
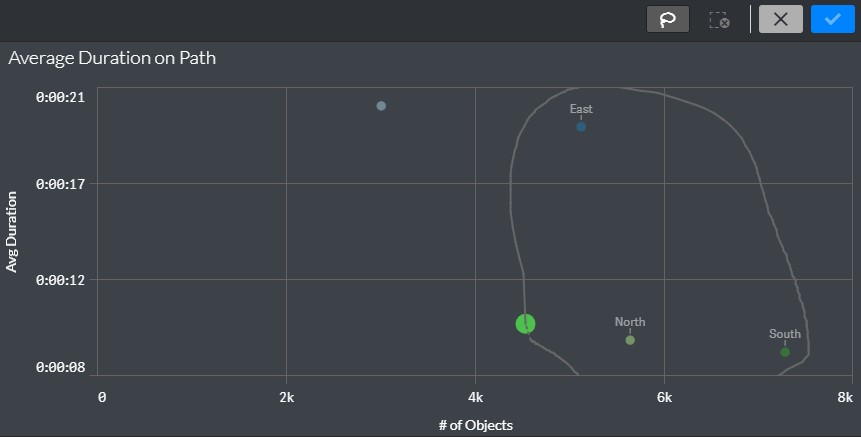
Lasso Selection
Click inside the visualization.
Click the lasso selection tool.
Draw a freehand circle to capture and select data points. Be sure to close off the selected area by returning to the selection starting point in your freehand drawing.
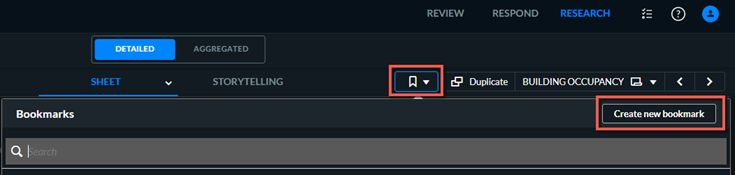
Bookmarks
You can add bookmarks to save your selections within the sheet. A bookmark can later restore your filters and dashboard selection. To create or restore a bookmark, click  and then click the Create new bookmark button.
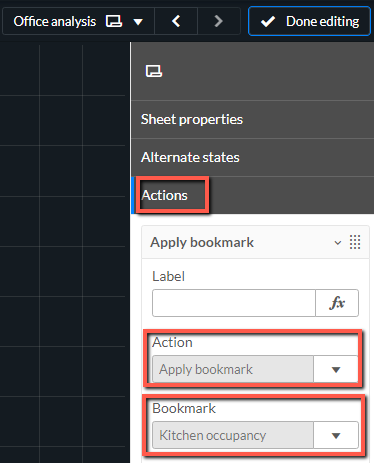
You can set a bookmark to be activated automatically when you open the dashboard as follows:
From the dashboard, click the Edit sheet button.
Open the Sheet Properties.
Select the Actions tab.
Click the Add action button.
From the Action drop-down list, select Apply bookmark.
From the Bookmark field, select the bookmark that you want to use when opening the dashboard.
Click the Done editing button.
Downloading Charts
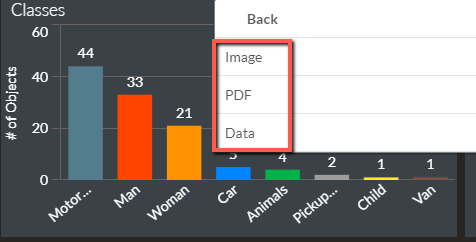
To download a chart, right-click on the chart and select Download as.
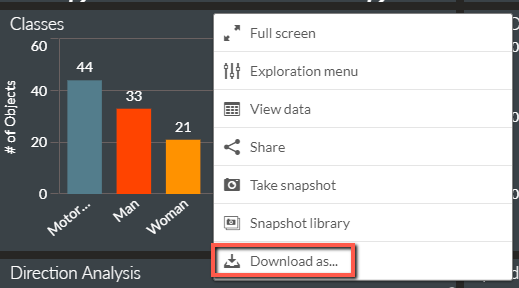
Then select whether to download the chart as an image or PDF or whether to export the data as an .xlsx file (Data).
Taking Snapshots
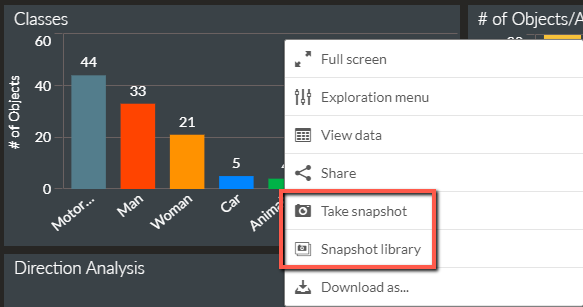
To take a snapshot of the chart, right-click on the chart and take a snapshot by clicking the Take snapshot option. You can then click the Snapshot library option to view the images that you saved.
Editing Properties with the Exploration Menu
From any chart, right-click and select the Exploration menu option to zoom into the chart and make changes to the properties without having to go into Edit mode.
To close the menu, click the  icon.
icon.
Viewing a Chart’s Data
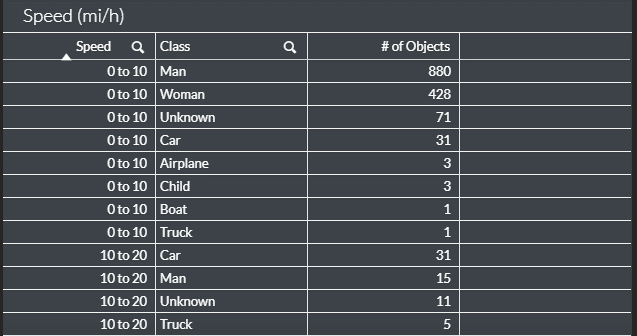
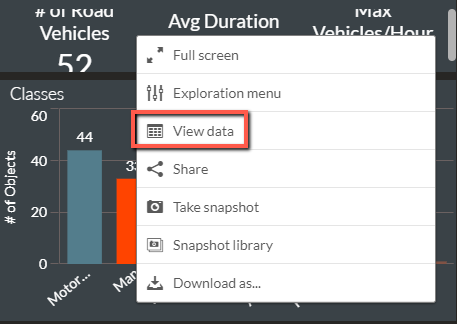
You can quickly view any chart’s data in a table format by right-clicking on the chart and selecting the View data option.
The chart’s data will be displayed in a table similar to the image below.