Activity Heat Map
To generate an activity heat map:
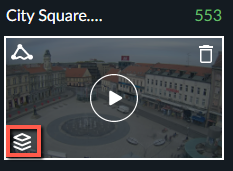
Click the Visual Layers control (
 ).
).
Click the Activity icon (
 ) to display an activity heat map layer, which highlights areas in which increased event movement has been detected (see below).
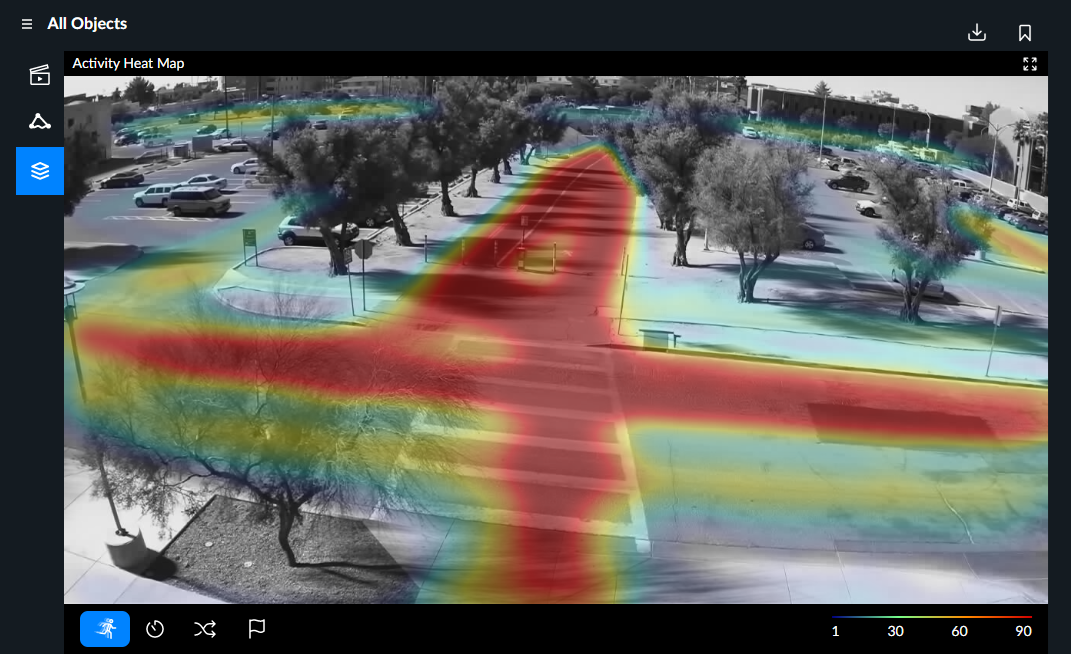
The activity heat map legend (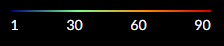 ) available at the bottom of the synopsis playback window indicates the number of detected objects associated with each of the various heat map colors.