External Data
External data is a data file consisting of data from non-video sources that are generated outside of the BriefCam platform.
This data can be displayed on the same dashboard widgets and graphs as data extracted from video, and by that assist in the later analysis of correlations between the external data and foot-traffic, vehicle-traffic, duration, paths, areas or any other analysis that can be done only based on video metadata BriefCam extracts.
The correlation between the external data video data is done with one of five data integration templates as described below.
Note
External sources can be ingested into BriefCam based on files in a self-served manner or integrated into a continuous data source through ODBC, Oracle, MySQL or other databases. The latter can be done with BriefCam’s assistance through professional service.
Uploading External Data
To add an external .csv or .xls file:
Click the EXTERNAL DATA tab.
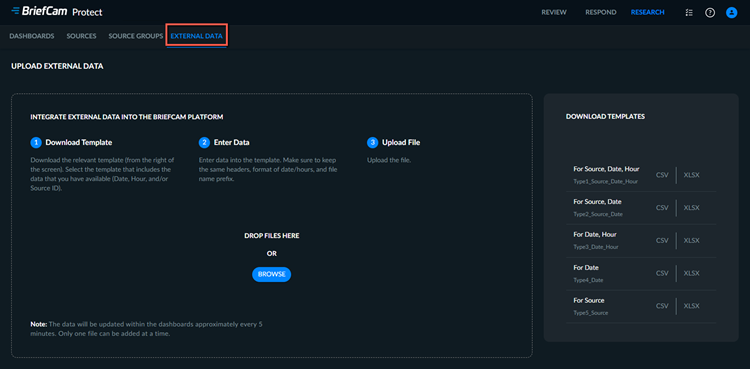
Decide which elements (source, date, and/or hours) from your external source will be the link to the data in BriefCam. Download the template that includes those elements in its description.
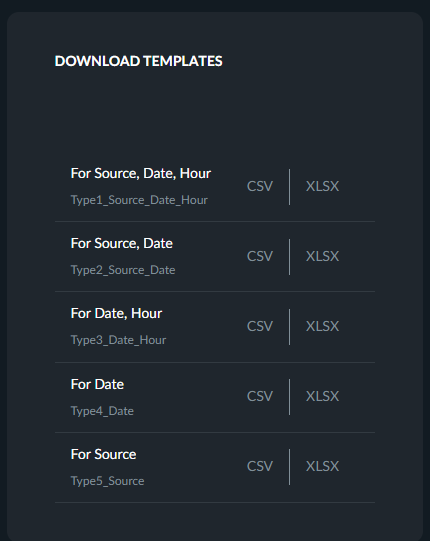
Enter your data into the template files by following the steps in the External Source File Format Instructions section below.
You can either drag and drop video source files to the dialog or click Browse to bring up a standard file selection dialog.
Click Upload.
Note
The data will be available within the dashboards on the next BI platform run (usually every 5 minutes).
External Source File Format Instructions
Note
CSV files should be edited in a text editor and not in Excel (because it can mess up the formats of the fields, especially dates and times).
Keep the structure and header names of the template so that BriefCam will know how to import the data. Each file type contains key columns which the data will be matched according to, and optional additional columns that contain the customer’s external data:
Matching Key | External Data | ||||
Type | Source | Date | Hour | Dimension_1..10 | Measure_1..10 |
Type1 | v | v | v | Optional | Optional |
Type2 | v | v | Optional | Optional | |
Type3 | v | v | Optional | Optional | |
Type4 | v | Optional | Optional | ||
Type5 | v | Optional | Optional |
The cells that are marked with a checkbox in the table above need to be filled in with the values from your sources in BriefCam.
The format of the columns should be as follows:
Source – The Source column needs to contain the source ID, for example: 22. See the example below to determine how to find your source’s ID.
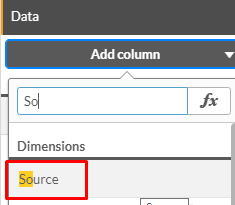
Create a new sheet, drag a table chart onto the sheet, and click Add dimension.
Type
sourceand from the Fields list, select SourceID.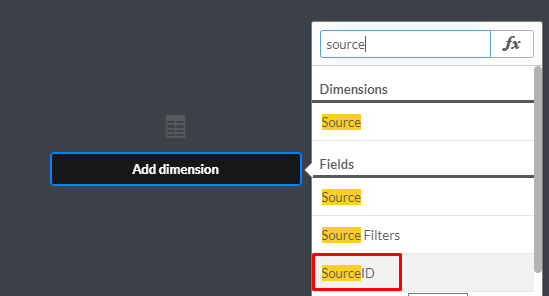
Add the Source dimension to the table.
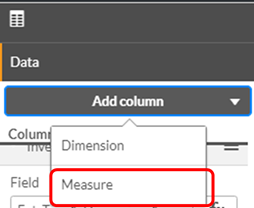
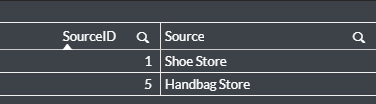
You’ll now have a table with the sources’ IDs and names.
Date – Add another column with the Date dimension. The date format is DD/MM/YYYY, for example: 24/09/2018 (If you’re not sure if the month or day is appearing first, add another dimension: Month, to the table).
Hour – Add another column with the Hour dimension.
Hour (hh) in 24H format, for example: 13:00, 09:00 (you should add the leading zero).
# of People – Add another column with the # of People measure.
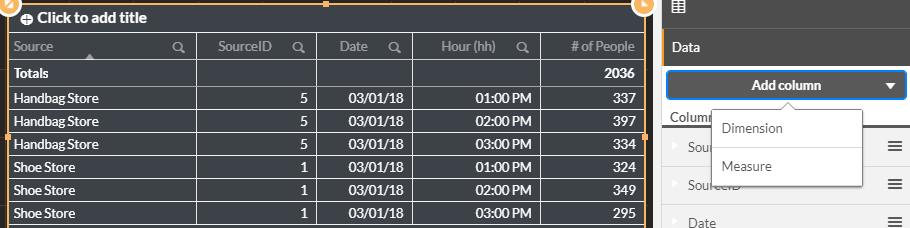
You now have a table with the Source, SourceID, Date, Hour and # of People.
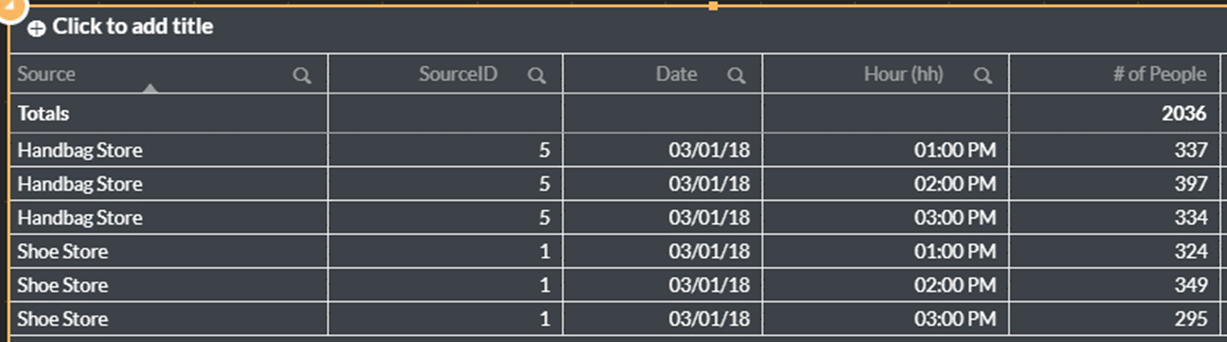 |
The columns of the table should be matched to the columns as shown in the image below.
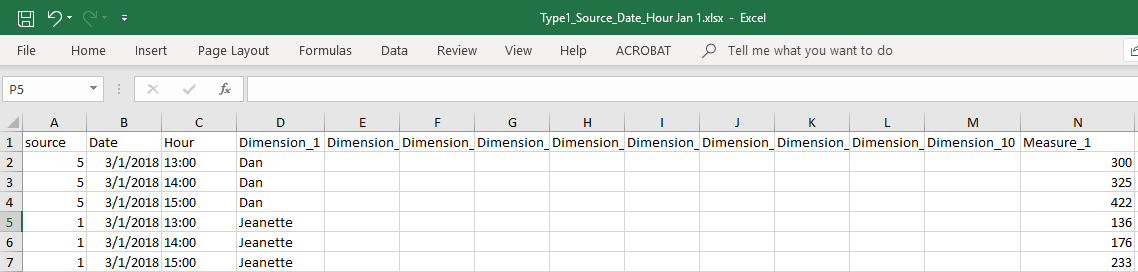
Add data in at least one dimension or measure. You can enter whatever values you want in these columns, but it’s important that you don’t change the name of the text in the first row. It’s also a good idea to make a list of what each of the dimensions and measures stand for in a separate document. For example, Dimension 1 = Employee name.
Dimension 1..10
These are optional columns to import textual data into the dashboards, so that the data can be grouped accordingly, such as the department or manager name.
Measure 1..10
These are optional columns to import numeric data into the dashboards, so that the data can be aggregated accordingly, such as total sales and number of employees.
Remember that the file name must include the correct prefix from the following prefixes:
Type1_Source_Date_Hour for files with a Source, Date and Hour columns.
Type2_Source_Date for files with a source and dates.
Type3_Date_Hour for files with a source and hours.
Type4_Date for files with dates.
Type5_Source for files with a source.
Adding External Data Sources to Dashboards
The following is an example of how to add an external data source to the dashboards.
Click the EXTERNAL DATA tab.
Upload your file. The data will be available when the RESEARCH platform is updated (about every 5 minutes).
Click on the table that you created earlier.
Click Add column and then Dimension.
Type
extand select Ext_Type1_Dimension_1.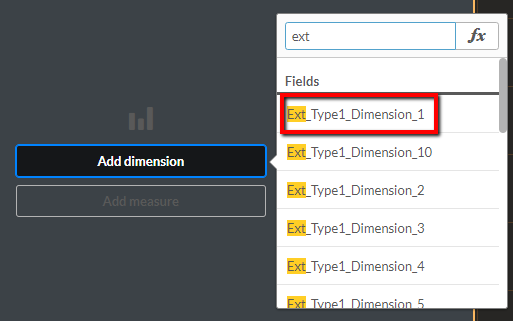
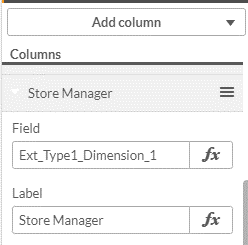
Give the extension a meaningful name.
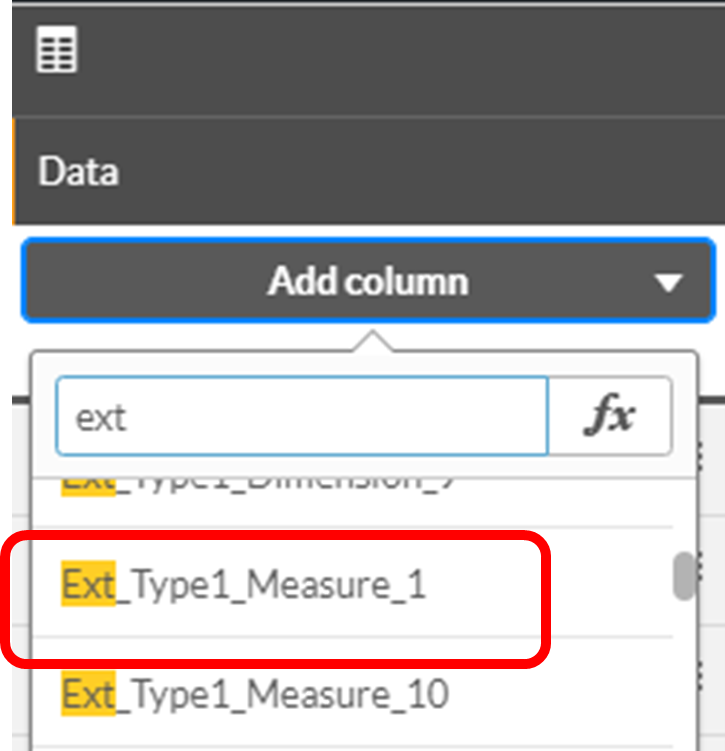
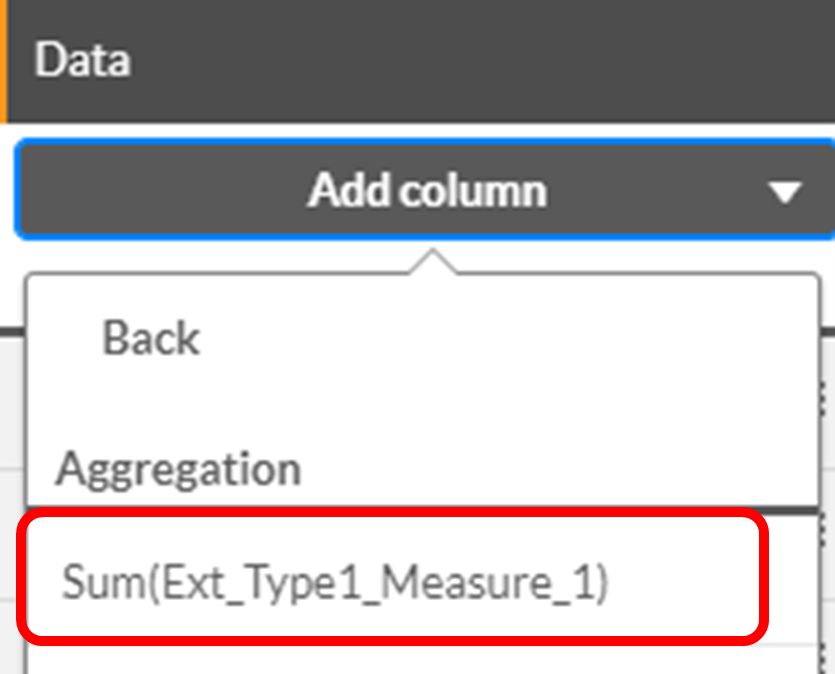
Click Add column, click Measure and select Ext_Type1_Measure_1.
Set an aggregation, such as Sum and give the measure a meaningful name.
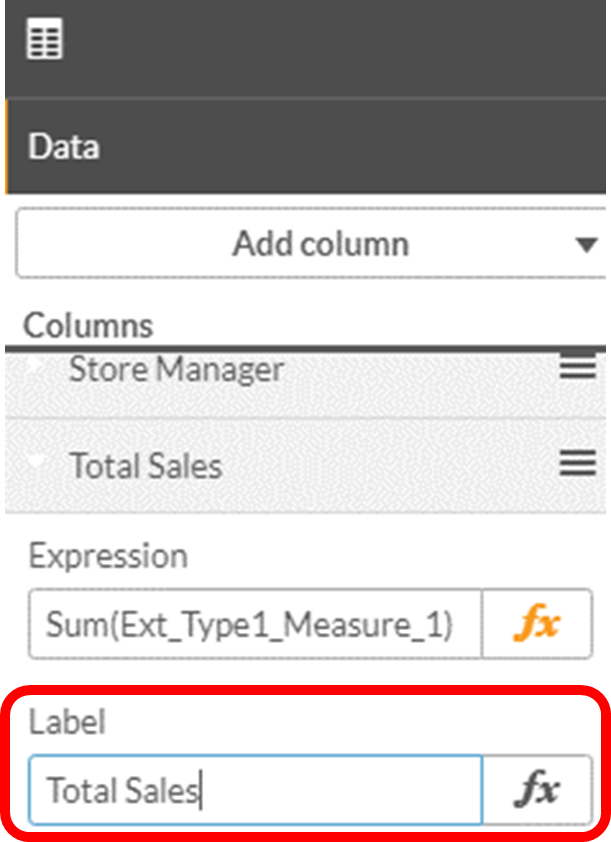
Now you’ll add a Treemap chart.
Drag a Treemap chart onto the dashboard.
Add the external data source dimension to the chart:
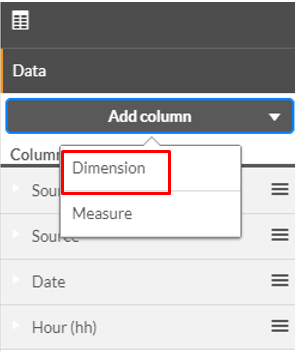
Click Add column and select Dimension.
Type
extand select Ext_Type1_Dimension_1.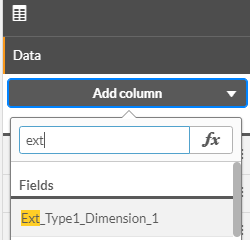
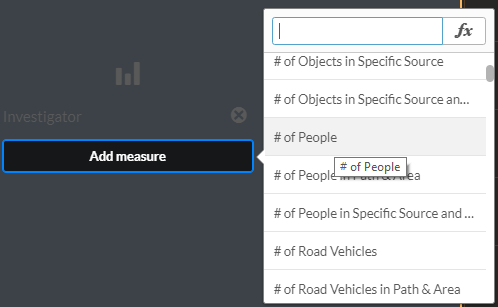
Add the measure: # of People.
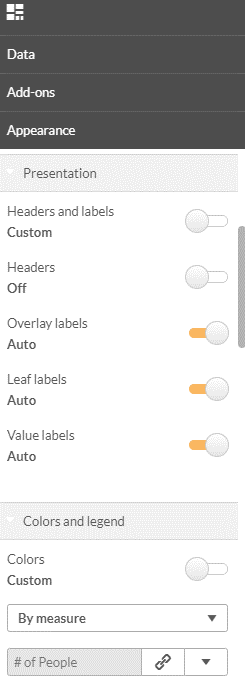
You’ll now set the presentation.
Set the Headers and labels to Custom.
Set the Headers to Off.
Set the Value labels to Auto.
Set the Colors to Custom.
Select By measure.
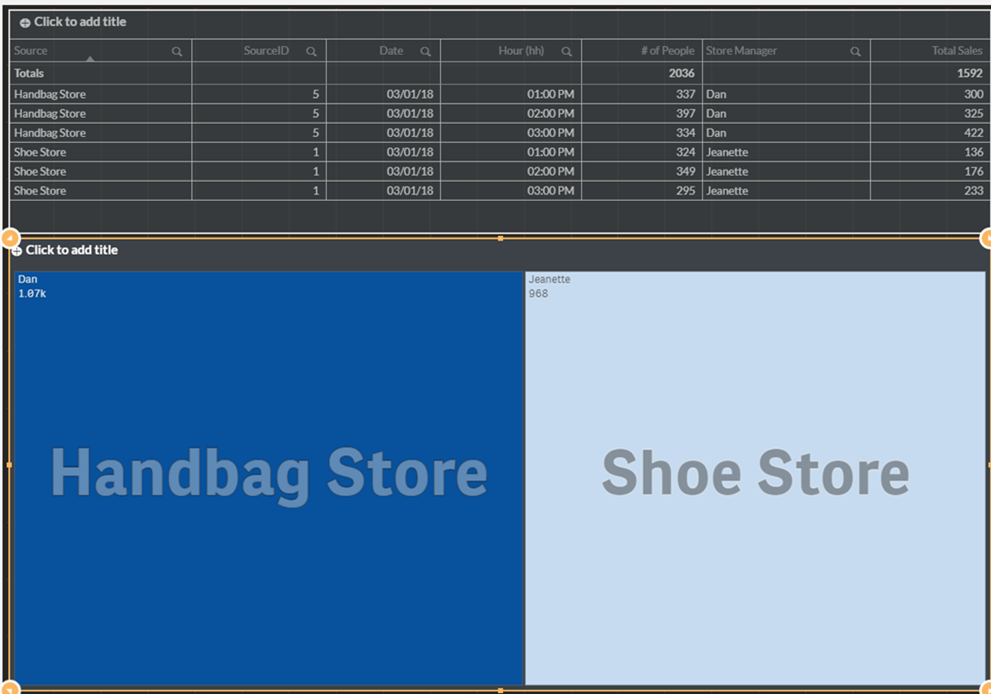
You now have a tree chart with data from an external source (Store Manager) and data from BriefCam (# of People) for the two sources (Handbag Store and Shoe Store).
Important Notes
The external data source data is loaded within the dashboards every time that the BI platform runs (usually every 5 minutes). The data is inserted completely every run, meaning a full load and not incremental.
All the external data source files are loaded to the following shared folder on the RESEARCH server:
qlikshare\ExternalData.If the same record exists more than once within the external data source file(s), it will be inserted as only one record within the BI platform.
If within the external data source file(s), there are two different records with the same key, but with different measures, then two records will be inserted into the BI platform and their measures can be aggregated within the dashboards.
For example, when loading the following external data source file:

The data appears as two records in the dashboards:

And can be aggregated to one record:

If within the external data source file(s), there are two different records with the same key, but with different dimensions, then two records will be inserted into the BI platform based on the two different dimensions.
For example, when loading the following external data source file:

The data appears as two records in the dashboards:
