Displaying a Specific Visual Layer
Open the Master items, and drag a Visual Layer visualization, such as Visual Layer: Activity Heat Map onto the dashboard.
Unlink the visualization by clicking on the more (
 ) button and clicking Unlink visualization.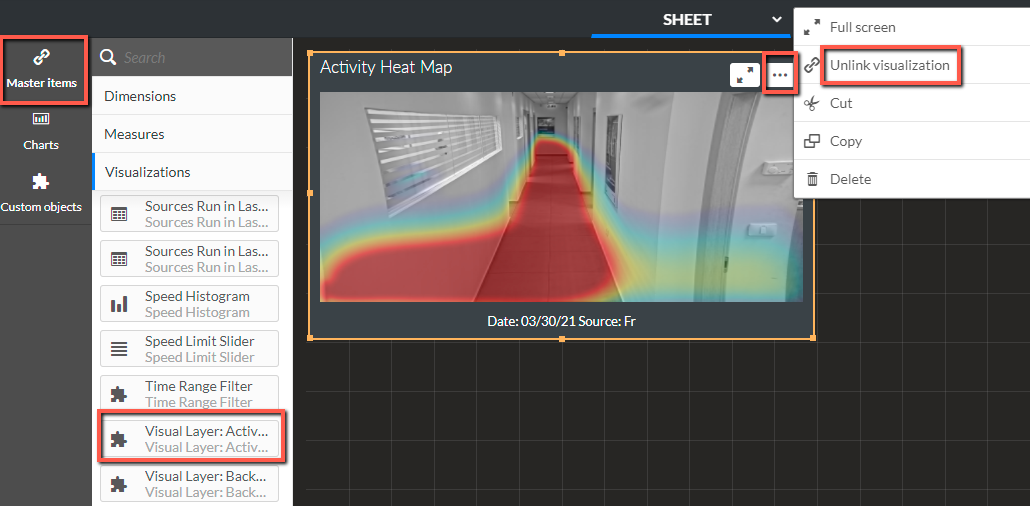
Click OK.
In the properties, open the Measures section and click on the expression.
Click on the expression (
 ) button.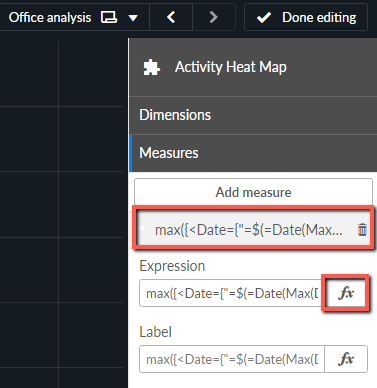
Delete the existing expression and enter the following string:
=max({<Date={"=$(=Date(Max(Date),'DD/MM/YYYY'))"},[Source] = {"Source Name"}>} Date)In the
{“Source Name”}string, replace the wordsSource Namewith the name of your source, such as{“Shoe Store”}, and click Apply.The image on the dashboard will change. However, notice that the footer at the bottom did not change.
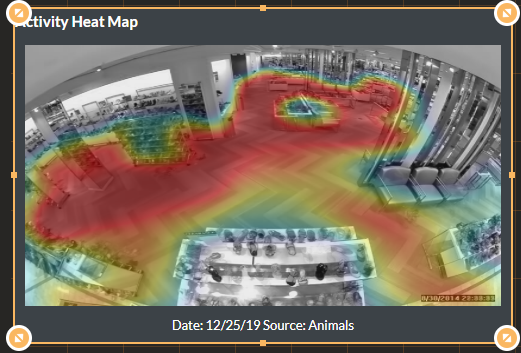
To change the footer, go to the Appearance section and from the Footnote field, click the expression button.
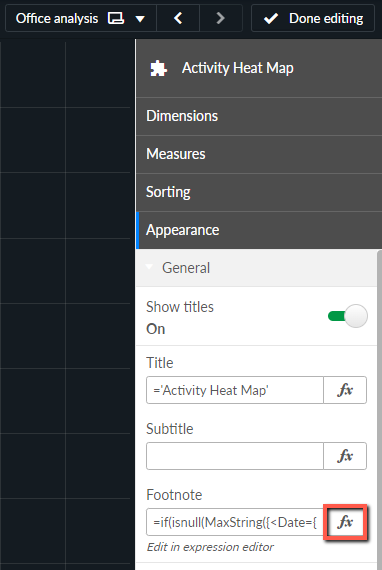
Delete the expression and copy and paste the following string:
=if(isnull(MaxString({<Date={"=$(=Date(Max(Date),'DD/MM/YYYY'))"}, [Activity_Heat_Map_URL]-={"-"}>}Source)),MaxString({<Master_Item_Name={'No Image Found'},Master_Item_Type={'Others'},Materlanguage={$(vLanguage)}>}Master_Item_Label),'Date: ' & max({<Date={"=$(=Date(Max(Date),'DD/MM/YYYY'))"},[Source] ={"Source Name"}, [Activity_Heat_Map_URL]-={"-"}>}date(Date,VDate)) & ' Source: ' & MinString({<Date={"=$(=Date(Max(Date),'DD/MM/YYYY'))"},[Source] ={"Source Name"}, [Activity_Heat_Map_URL]-={"-"}>}Source))Note that the string above is for Activity Heat Map visual layers. For other visual layers, see the strings at the end of this section.
In the two instances of the
{“Source Name”}string, replace the wordsSource Namewith the name that you want to appear in the footnote, such as{“Shoe Store”}, and click Apply.
The footnote on the dashboard will change (as shown in the image below).
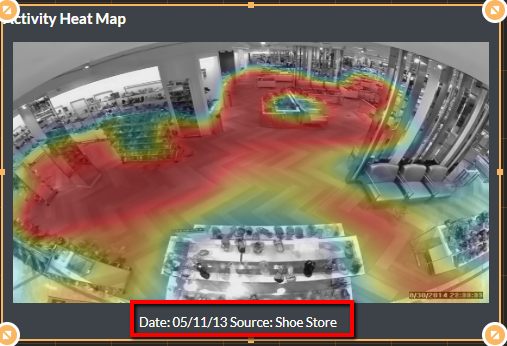
The footnote strings for the other visual layers are as follows:
Background Changes Footnote
=if(isnull(MaxString({<Date={"=$(=Date(Max(Date),'DD/MM/YYYY'))"}, [Background_Changes_URL]-={"-"}>}Source)),MaxString({<Master_Item_Name={'No Image Found'},Master_Item_Type={'Others'},Materlanguage={$(vLanguage)}>}Master_Item_Label),'Date: ' & max({<Date={"=$(=Date(Max(Date),'DD/MM/YYYY'))"},[Source] = {"Source Name"}, [Background_Changes_URL]-={"-"}>}date(Date,VDate)) & ' Source: ' & MinString({<Date={"=$(=Date(Max(Date),'DD/MM/YYYY'))"},[Source] = {"Source Name"}, [Background_Changes_URL]-={"-"}>}Source))
Common Paths Footnote
=if(isnull(MaxString({<Date={"=$(=Date(Max(Date),'DD/MM/YYYY'))"}, [Common_Path_URL]-={"-"}>}Source)),MaxString({<Master_Item_Name={'No Image Found'},Master_Item_Type={'Others'},Materlanguage={$(vLanguage)}>}Master_Item_Label),'Date: ' & max({<Date={"=$(=Date(Max(Date),'DD/MM/YYYY'))"},[Source] = {"Source Name"}, [Common_Path_URL]-={"-"}>}date(Date,VDate)) & ' Source: ' & MinString({<Date={"=$(=Date(Max(Date),'DD/MM/YYYY'))"},[Source] = {"Source Name"}, [Common_Path_URL]-={"-"}>}Source))
Dwell Heat Map Footnote
=if(isnull(MaxString({<Date={"=$(=Date(Max(Date),'DD/MM/YYYY'))"}, [Dwell_Heat_Map_URL]-={"-"}>}Source)),MaxString({<Master_Item_Name={'No Image Found'},Master_Item_Type={'Others'},Materlanguage={$(vLanguage)}>}Master_Item_Label),'Date: ' & max({<Date={"=$(=Date(Max(Date),'DD/MM/YYYY'))"},[Source] = {"Source Name"}, [Dwell_Heat_Map_URL]-={"-"}>}date(Date,VDate)) & ' Source: ' & MinString({<Date={"=$(=Date(Max(Date),'DD/MM/YYYY'))"},[Source] = {"Source Name"}, [Dwell_Heat_Map_URL]-={"-"}>}Source))