Using the Hub
When you access the Hub, you’ll see three tabs: SITES, RESPOND, and RESEARCH.
SITES Tab
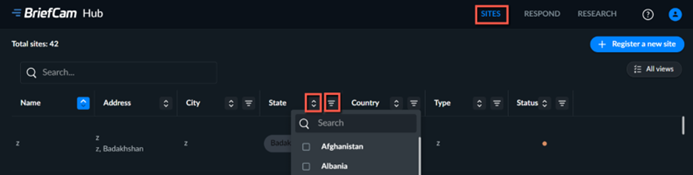
In the SITES tab you’ll see all the sites associated with the Hub.
You can filter the columns by clicking the  icon and search in a specific column by clicking the
  icon. You can also search across all columns by using the Search field.
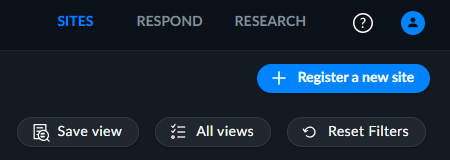
Once you apply filters, you can save the filters by clicking the Save view button. You can access any saved views by clicking the All views button.
Accessing Sites as a Hub User
When you hover over a site in the Hub, you’ll see four icons.
Icon | Description |
 | Open the Hub’s RESPOND module showing only this site’s data. |
 | Open the Hub’s RESEARCH module showing only this site’s data. |
 | Open the site’s REVIEW module. |
 | Edit the site’s details. All details can be edited except for the Site ID. |
When you open a site via the Hub, you’ll see the name of the site in three locations. This will help you keep track of which sites are open.

Using a Site
For information about using a site, see the BriefCam User Guide.
Note
For sites, the Dashboards view is not enabled.
RESPOND Tab
In the RESPOND tab, you’ll see all the alerts from all the connected sites.
By default, the ALERTS tab opens displaying the last 24 hours of alerts. The Since time will remain as-is until you refresh the screen. You can change the display using the drop-down list at the top of the screen. The default time for this drop-down list can be changed using the DefaultTimeDisplayedInRespondInDays environment setting in the BriefCam Administrator Console. To show all alerts, enter -1. To show half a day, enter 0.5.

You can also filter by camera or by rule using the filters on the right-hand side:
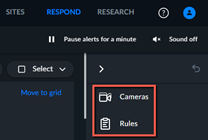
When you filter by Cameras, you will be able to search by sites and cameras. When you filter by Rules, you will be able to search by sites and rules.
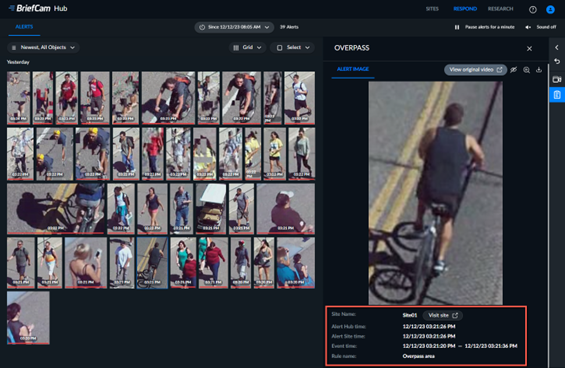
When you click on an alert, you’ll see an alert image with details about the alert under the image. You can also click the View original video link to play the original video on the site.
You will also see the time zone of each alert.
RESEARCH Tab
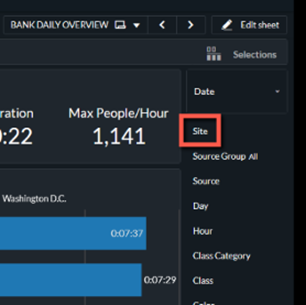
In the RESEARCH tab, you’ll see dashboards containing all the aggregated data from all the sites. You can filter by site using the Site filter on the right-hand side:
Multi-Site Dashboard
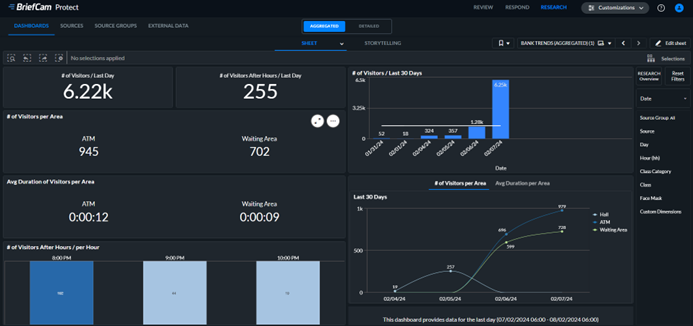
The BANK TRENDS aggregated dashboard is available on Hub environments and shows an overview of the data for the last day.
To use the dashboard as intended (including the after-hours chart), either use real-time channels for this dashboard or use on-demand channels that are scheduled for a daily (24h) processing at 6 AM (and not midnight).
To change the default dashboard to the BANK TRENDS dashboard:
In the BriefCam Administrator Console, find the QlikAggregatedAppSheetID environment setting.
Change the value to:
bf295448-e53b-434c-9dcc-821f85d3d663