

User interface details
The failover web console consists of two main tabs:
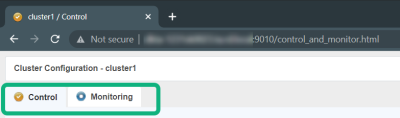
On the Control tab, you can view the following:
|
Tab |
Description |
|---|---|
| Resources | View the resources status of the module. Place the mouse cursor over the resource name to get the internal name of the resource. |
| Module Log | Read the execution log of the module. Set or clear the verbose log’s checkbox to display the short log (with only E messages) or the verbose log (all messages including debug ones). |
| Application Log | Read application output messages of start and stop scripts. These messages are saved on the server side in SAFEVAR/modules/AM/userlog.ulog (where AM is the module name). |
| Commands Log | Display the commands that have been executed on the node (commands applied on the module and all global commands). |
| Information | Check the server level and the module configuration. |
On the Module Log, Application Log, and Commands Log tabs, click on the refresh button to get the last messages or on the save button to save the log locally.
The Monitoring tab presents a simplified view of the current state of the module instances.
You can view and manage the nodes on both tabs from the Cluster Configuration panel.
Cluster options
From the left-hand panel, you can:
-
Start or stop nodes and perform other actions. See also Node actions.
-
See the state of a node. See also Node states.
-
See the data synchronization status of a node. See also Node data synchronization statuses.
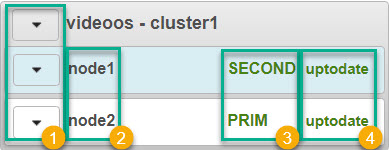
The control panel consists of four columns:
-
Node actions menu
 shows the options to change the state of a node.
 -
Node1 and node2
 : node1 corresponds to the computer you selected as the primary computer, while node2 corresponds to the computer you selected as the secondary computer.
 -
Node state
 column shows the current state of a node.
 -
The node data synchronization status
 column shows the current data synchronization status of a node. The column is not available when the failover cluster is connected to external SQL Server.
|
Option |
Description |
|---|---|
| Start | Start a node. |
| Stop | Stop a node. |
| Restart | Restart a node. |
| Swap | Swap the states of the nodes. |
| Expert | Stop and start a node, swap without data sync, force start or estimate the data sync. |
| Admin | Configure boot start, suspend or resume the error detection of module processes, start or stop all checkers, and set failover to on or off. |
| Support | Save logs, dumps, or snapshots for troubleshooting. |
|
Tab |
Description |
|---|---|
| PRIM | The data replicates from this node. |
| SECOND | The data replicates to this node. |
| ALONE | No data replication. The node acts as a single unit. |
| STOP | The node stopped, and no redundancy is available. |
| WAIT | (Transient) The node is starting up (magenta) or waiting for the availability of a resource (red). |
State colors
|
Tab |
Description |
|---|---|
| Green | The node is available. |
| Magenta | The node status is transient. |
| Red | The node is unavailable. |
Node data synchronization statuses
|
Tab |
Description |
|---|---|
| uptodate | The replicated files are up-to-date. |
| not uptodate | The replicated files are not up-to-date. |
| connection error | Cannot connect to the node. |
| not configured | The configuration is missing from the node. |