System Flow overview
The diagram below illustrates how audit logs are generated, transmitted, and accessed in the new architecture. It is centered around the OpenTelemetry collector being deployed as a gateway in a single machine, but it can also be deployed as an agent on multiple machines. Services are now designed to emit server logs using the Open-Telemetry protocol to the configured destinations, which can vary depending on the specific XProtect deploy-ment:
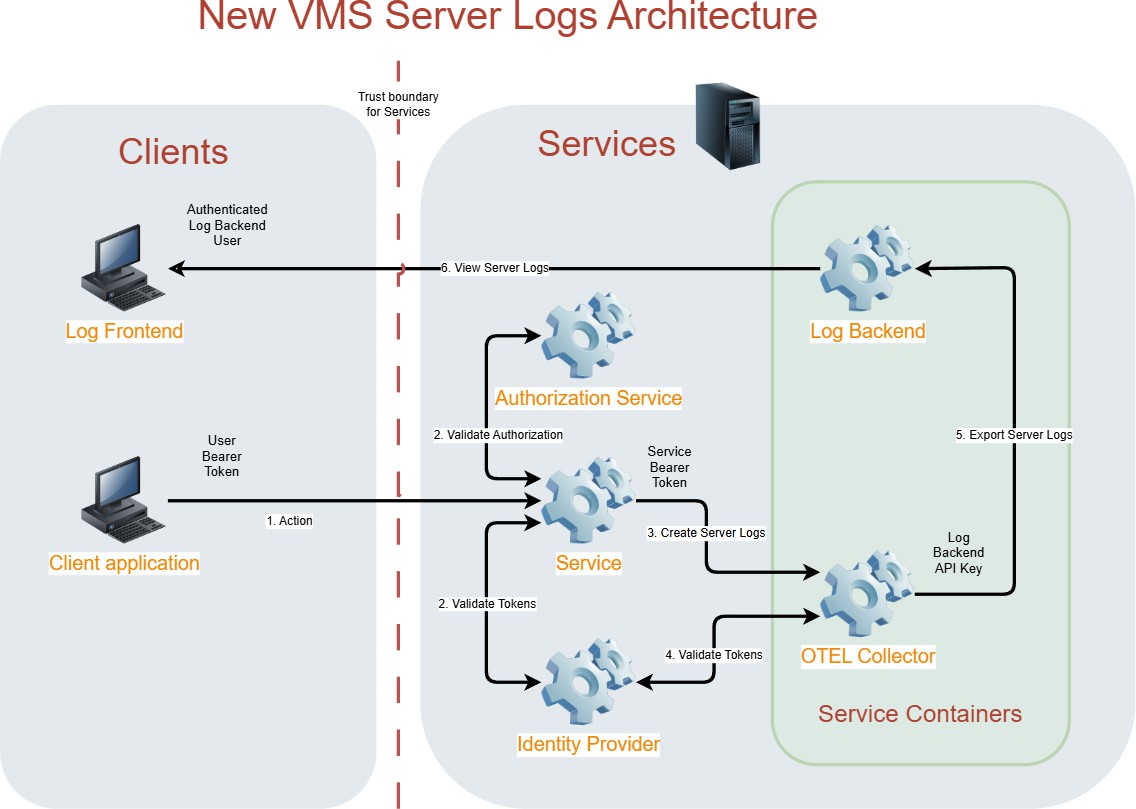 |
A client requests a service to run an action and includes the user’s access token.
Using the user’s access token, the service then validates the user’s identity against the identity provider, and checks if the user is authorized to run the requested action against the authorization service.
The service sends one or more log entries to the collector, which describe the action requested and its out-come, alongside its own access token.
The collector validates the service’s access token against the identity provider and verifies the presence of a service-specific audience in the token.
The collector exports the logs to the backend(s), using the backend-specific authentication configured. The log backend receives and stores the logs from the collector.
Using a supported client, an authorized user can access the logs and use any tools built into them. The cho-sen log backend defines the supported clients and their user access control.