Sources
In the SOURCES tab, you define all of the video and data sources that you want to use in your dashboard.
You can schedule daily, one-time or continuous dashboard generation for any VMS video source, as well as the ability to define custom dimensions that enable advanced, detailed analysis of KPIs. In order to utilize custom dimensions, the dimensions need to be set before starting to process the video.
Note
Data for the RESEARCH source begins to be gathered when the source is created. If you previously created a case in the REVIEW module using the same camera, the data gathered from the case before the creation of the RESEARCH source will not be available in the RESEARCH module.
Creating/Editing a Source
To create or edit a source:
Click the CREATE A SOURCE button.
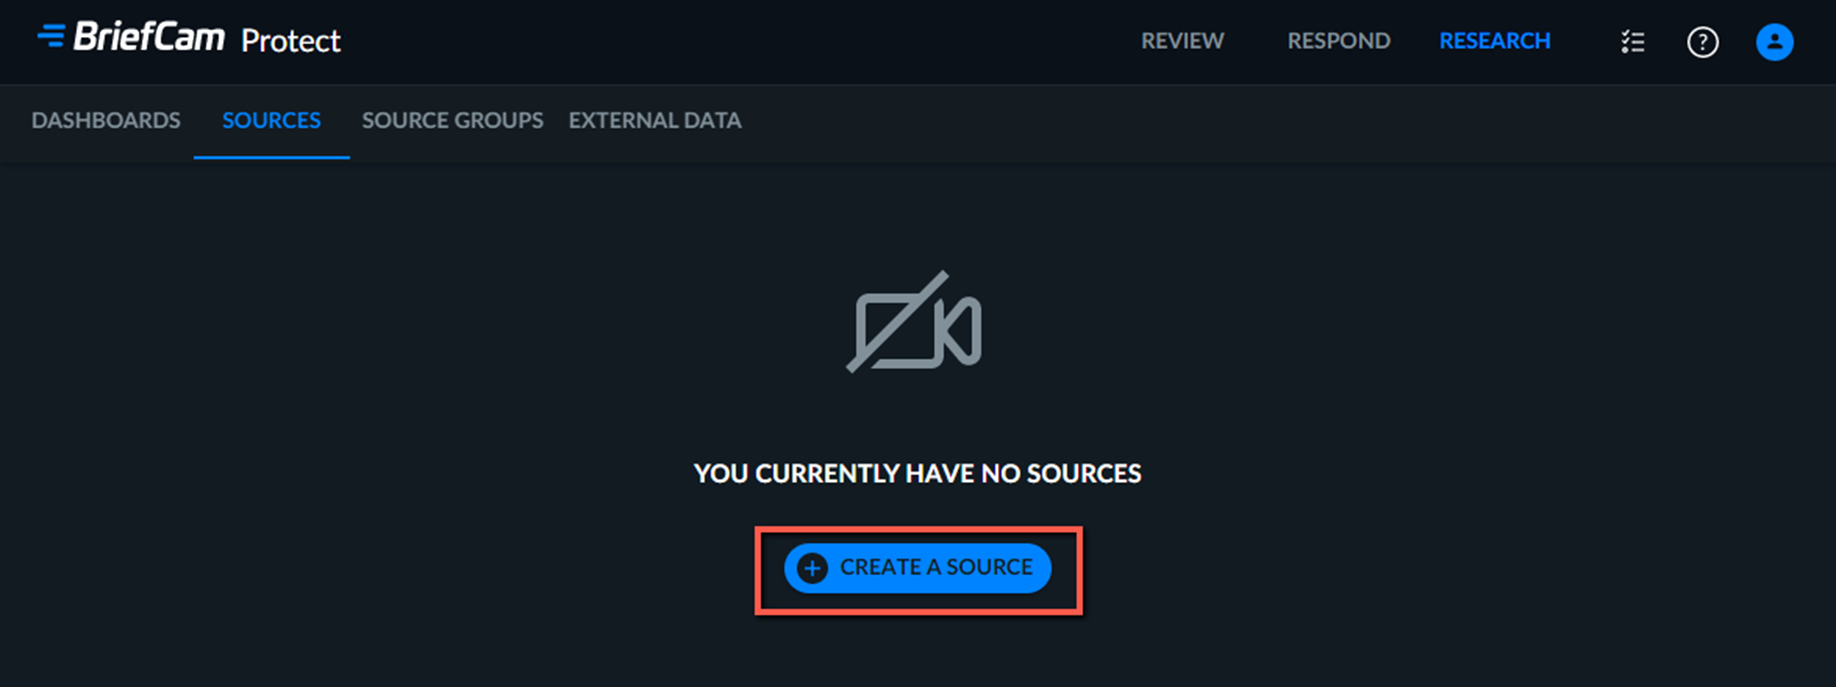
Name the source. The source name must be unique.
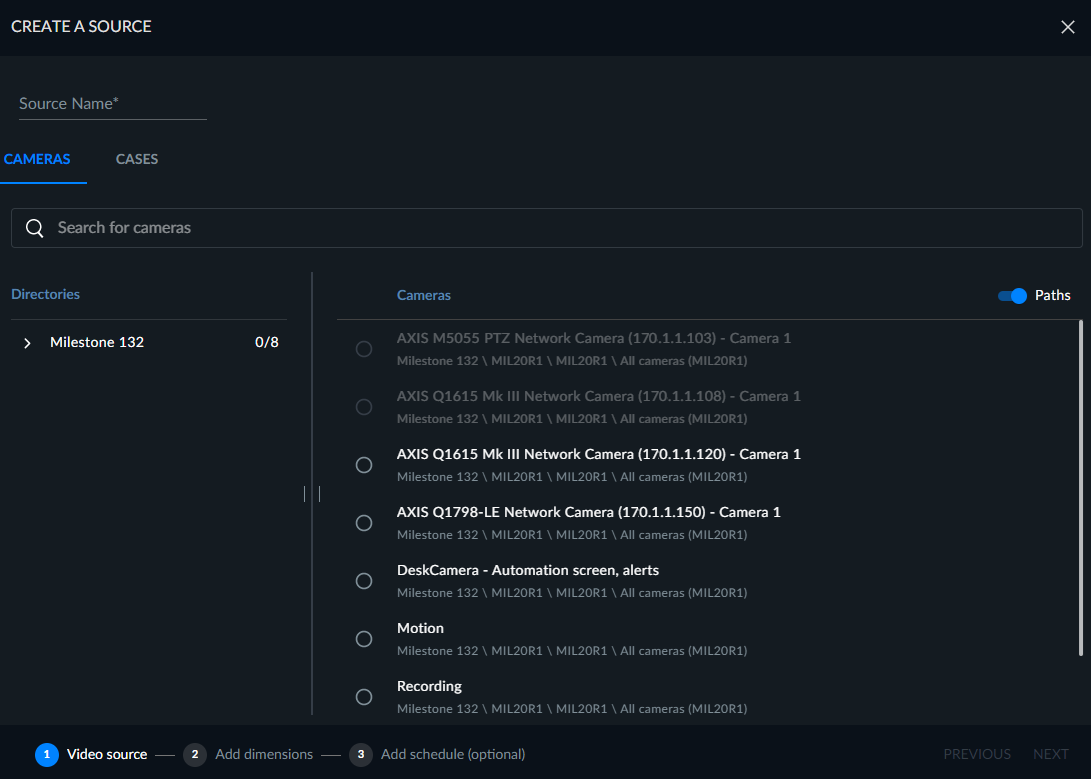
Select the video source, either Cameras or Cases.
If you select Cameras, you can configure a source for a single camera (that is not already associated with another source). If the camera is already added to another source, it will be greyed out.
If you select Cases, you can configure a source using a video file from a REVIEW case, including cases shared with you. Note that this functionality is not available for Camera sources. Therefore, if you are unable to select a case, this is because there are no uploaded files associated with the case or the uploaded files were not successfully processed.
For sources created from a REVIEW case:
The file can only be configured once as a RESEARCH source.
Scheduling is not enabled for this type of source since the data was already processed in the REVIEW solution.
Videos with up to 100,000 objects are supported. Videos with more than 100,000 objects are also supported. However, it may consume a lot of hardware resources and may take additional time to add the objects to the dashboards. When uploading 100,000 objects or more, it is recommended to first consult with your administrator to make sure that the required hardware resources are available.
If the video was deleted from the case, this source including its data will still appear in the RESEARCH solution.
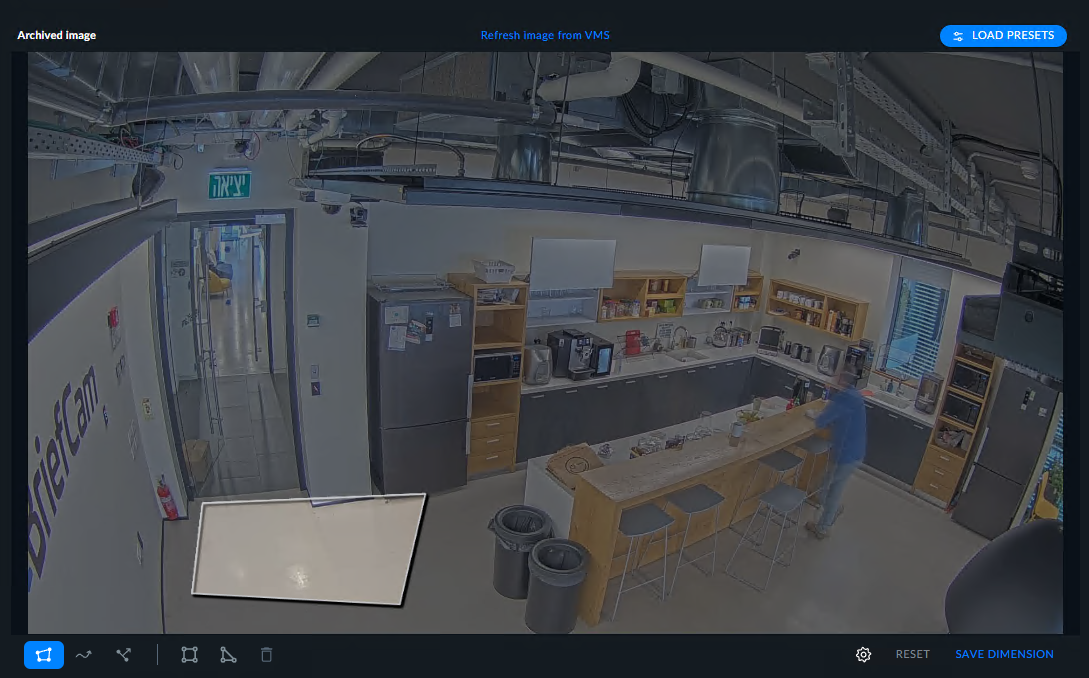
In the next screen you can click NEXT or you can first set custom dimensions. You can use a preset that was defined in the REVIEW module (for more information, see the Using REVIEW Presets section) or choose from the following dimension types:
Area – count the number of objects entering one or more user-defined areas. Areas can be set as three-sided (triangular) or four-sided (square) polygonal areas. Click the inclusion/exclusion button to choose whether to count the objects included in the area or excluded from the area.
Path – count the number of objects traveling along one or more user-defined paths.
Line Crossing – count the number of objects crossing over the line in a pre-defined direction.
You can set the Duration in Path or Duration in Area by clicking the gear
 icon and setting the minimum duration time. For example, by setting the Duration to 10 seconds, you will be able to count the number of objects whose duration within the path is at least 10 seconds.
Coverage tolerance settings (Low, Medium and High) can also be applied to Area, Path or Line Crossing settings (default is Medium). A high coverage tolerance level will result in the inclusion only of objects closely adhering to the drawn Path, Area or Line Crossing, whereas a Low coverage tolerance setting will result in the inclusion of additional objects that only loosely follow the defined Path, Area or Line Crossing.
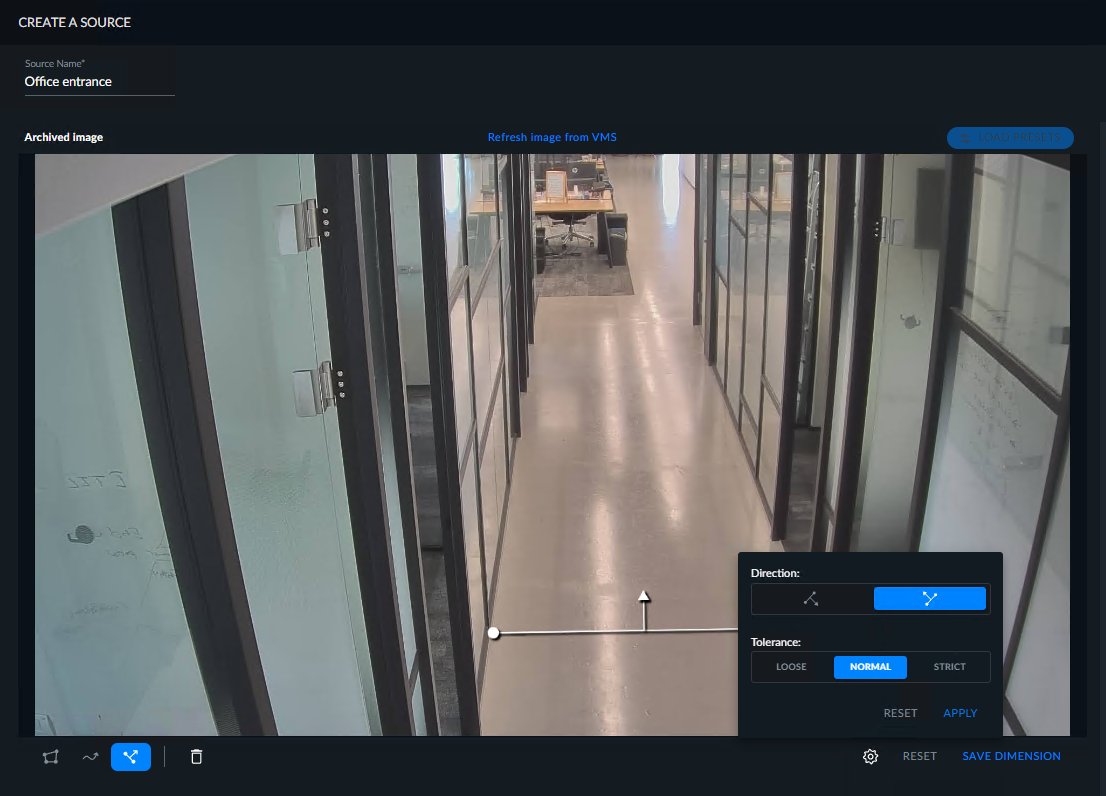
Notice that the image that is displayed is an archived image (as shown in the top left corner of the image). The archive image is displayed because getting a fresh image from the camera might take some time due to the VMS. The background image is saved by default every five minutes while processing the stream – the latest background image is used temporarily when setting up a rule/dimension. The default of five minutes can be changed in the
OX.inifile’sBGImageGenerationIntervalMinutesparameter.When there is a newer image available, you can click on the Refresh image from VMS button also in the top left corner.
Click APPLY.
Click SAVE DIMENSION and name the custom dimension (the name must be unique to the source).
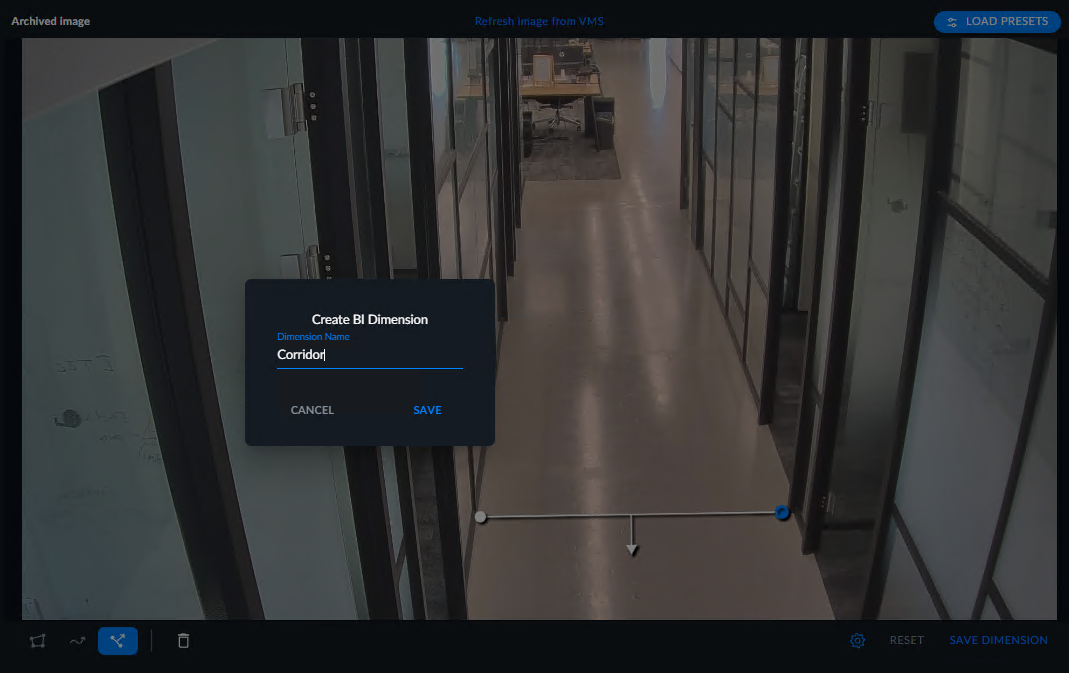
Click SAVE.
Once named, the custom dimension will appear in the left-hand corner.
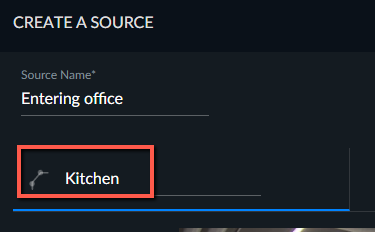
You can now add a schedule by clicking the ADD SCHEDULE button or you can skip this step by clicking the CREATE button.
If you are adding a schedule, select the schedule type (Continuous, Run Once, Daily or Weekly) and click SAVE.
Continuous scheduling is used to schedule RESEARCH sources to run in real-time mode, which is useful for up-to-date dashboards.
To use the Continuous mode, you must have the RESPOND solution (including a dedicated GPU).
Note
When continuous scheduled sources fail, recovery will be attempted after 6 minutes and then for an exponentially increasing amount of time between failures, up until 60 minutes, and then every 60 minutes. The default can be changed in the MaxRetryDelaytimeMinutes environment setting.
To stop the source from retrying, disable the scheduled source.
When creating a Continuous schedule fails due to the license check (status is "disabled"), to enable the schedule, you will need to delete the Continuous schedule and recreate it.
For Run Once and Daily schedules, you also can set when the scheduled task will run by entering a date and time in the Run on fields.
Click the CREATE button.
You can create multiple dimensions for the same source.
For sources created from REVIEW cases, if you want to add, edit or remove a custom dimension, you need to reload the video from within the REVIEW solution.
If you delete a custom dimension, the data collected regarding the custom dimension will be saved in database but will no longer be displayed in the dashboards.
Note
Research Editors can view and edit the sources created by other users and themselves. They can also create, edit and publish dashboards.
Research Viewers can edit sources that they created, and view the sources created by other users, including the areas and paths created. They can view and filter published dashboards and create stories.
Both Research Viewers and Research Editors are defined by the administrator.
Note that you can right-click to access action icons including copying the text in the table.
Using REVIEW Presets
If you created a preset in the REVIEW module that included Scene filters (Area, Path, or Line Crossing), you can use it when creating a RESEARCH custom dimension.
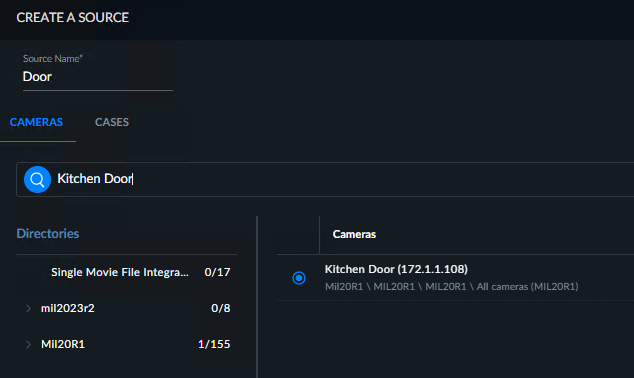
Create a source and select the same camera used in the REVIEW module.
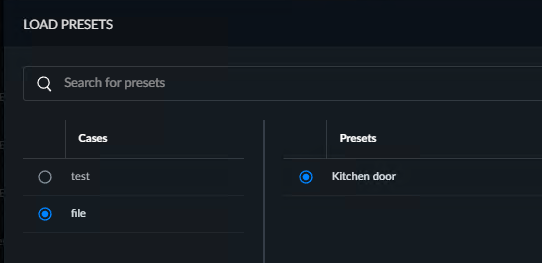
Click the LOAD PRESETS button.

Select the case that includes the preset and then select the preset.
Click APPLY and then CONFIRM.
The screen will appear with the Scene filters created in the REVIEW module. Click SAVE DIMENSION.
Give the dimension a name and click SAVE.
Click NEXT and add a schedule as described in the section above.
Status
In the SOURCES tab, the scheduling status of each source is indicated as one of the following:
Active – Activated by the user (or scheduler) and running with no error. For Continuous schedules that are Active, additional information will be displayed in parenthesis: Processing, Queued, or Recovering.
Inactive – Disabled by the user or scheduler.
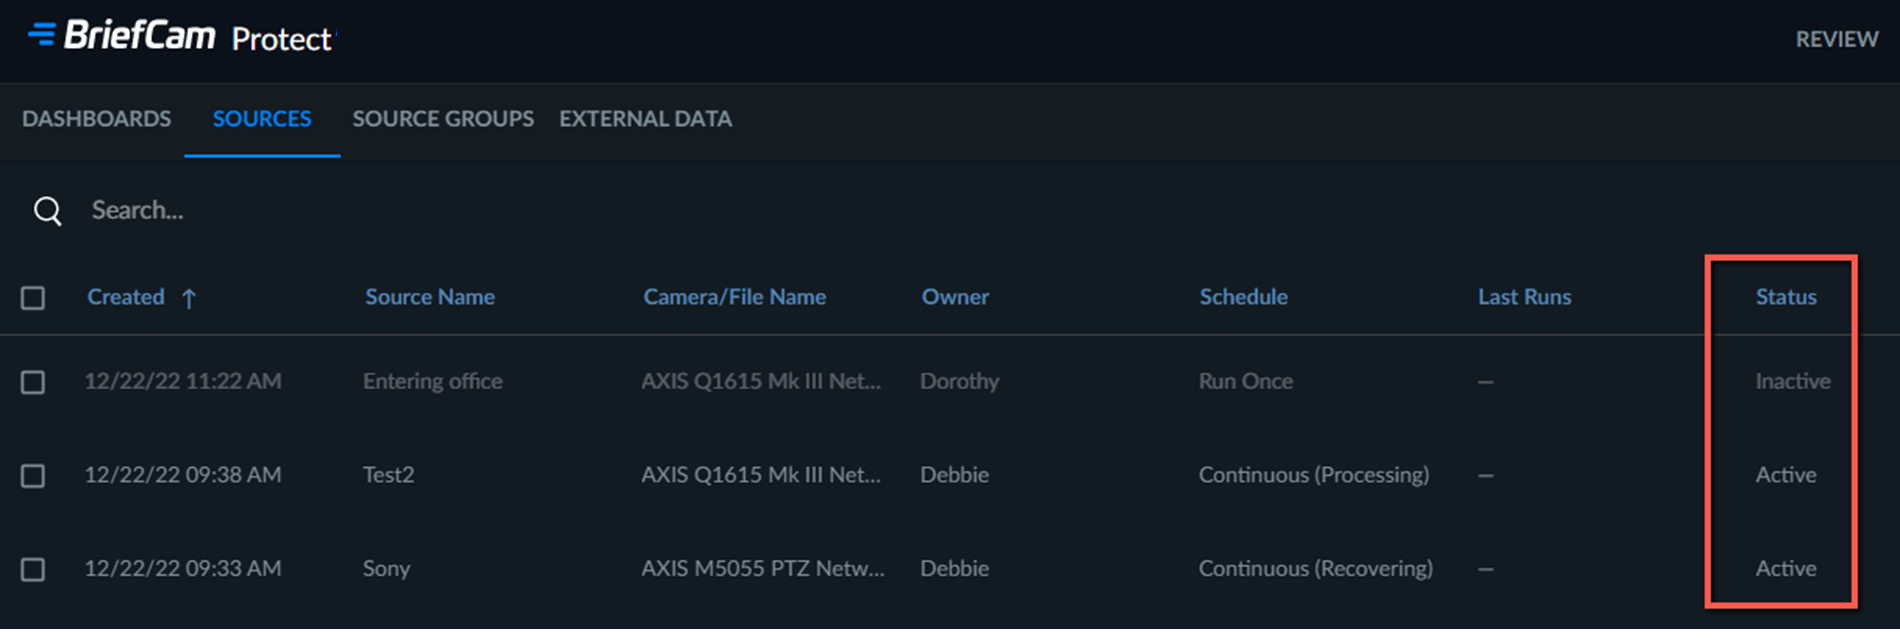
You can change the status of a source by hovering over the source and clicking the Disable  or Enable
  buttons.
If RESEARCH source is disabled, all of its scheduling tasks area also disabled.
Last Run of Source
There are two places for you to get information about when sources run within the RESEARCH platform.
In the SOURCES tab’s Last Run column, you can see the last time that the source data was processed.

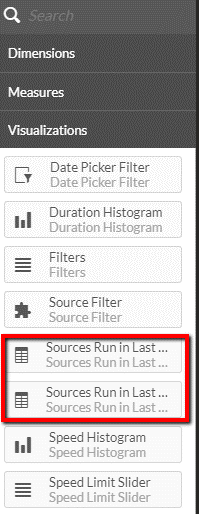
Within Dashboards, you can add from the Master item’s Visualizations section the Source Run in Last 30 Days or Source Run in Last 30 Days (by hour) tables to monitor the number of objects loaded to the BI platform per source and date.
Source Information
You can get information about the loading data to the RESEARCH platform by clicking on the information icon.

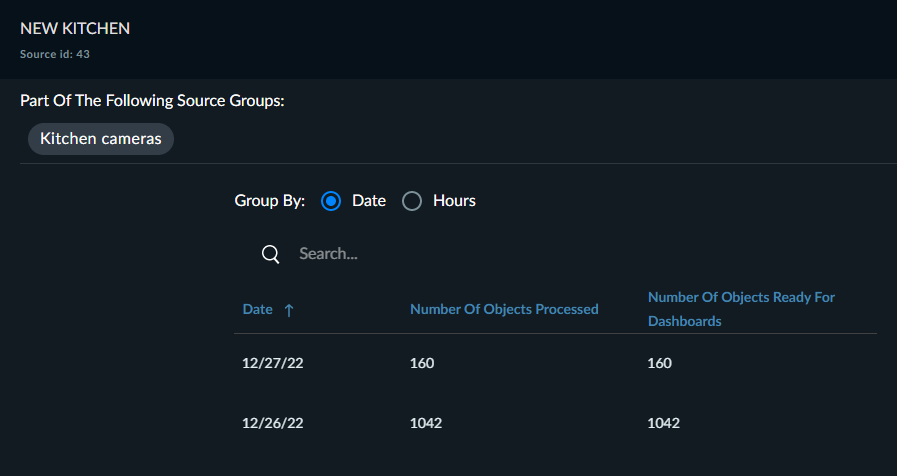
The table that appears lists all the groups related to the source and includes information from the last 30 days about the number of objects processed for the source vs. the number of objects that are ready to be uploaded to the dashboards in the RESEARCH module. The table can be grouped by date or hour and each column can be sorted. Searching is also available.