Events
Service Health
The status of the services appears at the top of the Events screen and are color-coded as follows:
Green – All services of this type are running.
Yellow – At least one service of this type is not running.
Red – All services of this type are not running.

System Events
The Events section displays system events. Each event is assigned with a severity of either Warning or Critical. Understanding these events can help you identify and troubleshoot potential issues.
The Systems events are:
Event | Category | Description |
Configuration Error | Not in use. | |
High CPU | Hardware-related | The CPU is under heavy load, which can impact overall system performance. |
High Memory | Hardware-related | The system's memory is being heavily utilized, potentially leading to performance issues. |
License Limit Reached | Hardware-related | The number of cameras connected to the system has exceeded the limit allowed by the current license. |
Maintenance Task Failed | Hardware-related | A scheduled maintenance task, typically for cleaning up artifacts or data, was unsuccessful. This might result in storage issues or performance degradation |
Process Down | Software-related | A critical system process has stopped functioning. This could disrupt system operations or specific features. |
Process Up | Software-related | A previously down process has restarted or resumed normal operation. |
Qlik Failed | Not in use. | |
Real Time Task Failed | Software-related | A task associated with a real-time rule or event processing has encountered an error. |
Real Time Task Recovered | Software-related | A task associated with a real-time rule or event processing has been recovered. |
Rendering Failed | Software-related | The system failed to create a synopsis or preview of recorded footage. |
Request Length Alert | Software-related | A processing task has been created for a specific camera with the task duration specified in hours. |
Rule Engine Failed | Not in use. | |
Service Akka Failed to Register | Akka-related | The Akka actor system, used for distributed calculations, failed to register with the BriefCam cluster. |
Service Registration Aborted | Akka-related | The registration process of the Akka actor system, used for distributed calculations, was interrupted or terminated. |
Service Registration Started | Akka-related | The registration process of the Akka actor system, used for distributed calculations, was started. |
Site Export Failed | Other | This indicates a failure in exporting data from a multi-site environment. |
Storage | Hardware-related | This category likely indicates issues related to storage space, such as running out of storage or encountering storage device errors. |
Task Failed | Software-related | Indicates a failed housekeeping task (used to delete old data to free storage). |
Task Queue Size | Software-related | Provides information about the size of the task queue. |
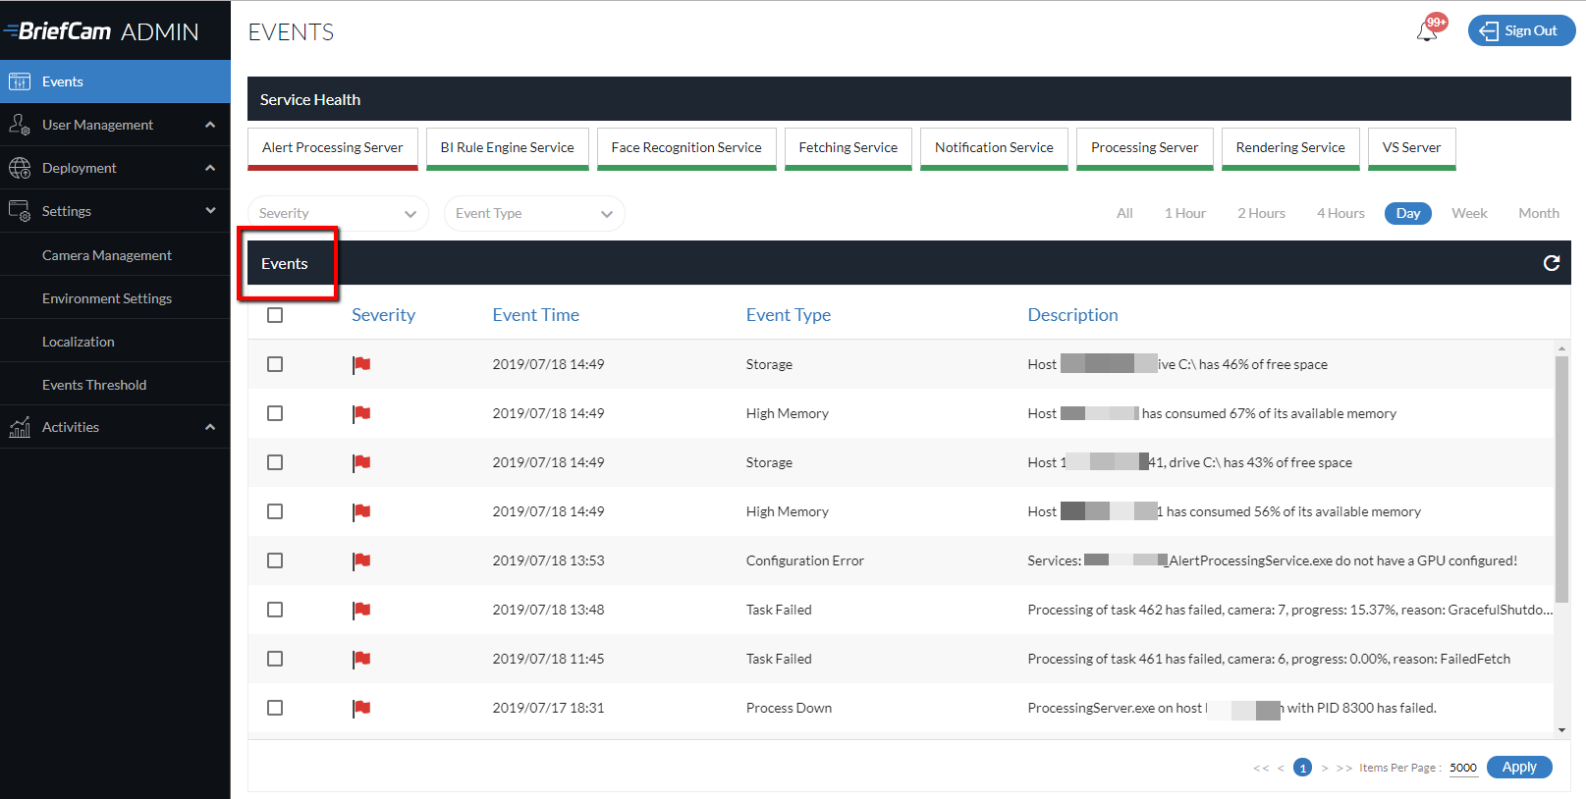
At the top right corner of the screen there is a notification icon  where you can see how many events have been received. The number represents the total in the system. Clicking on the notification icon from any tab, automatically opens the Events tab.
You can see events from the last hour, 2 hours, 4 hours, day, week and month by clicking the options in the top right corner. In addition, you can also refresh the screen by clicking the refresh icon.
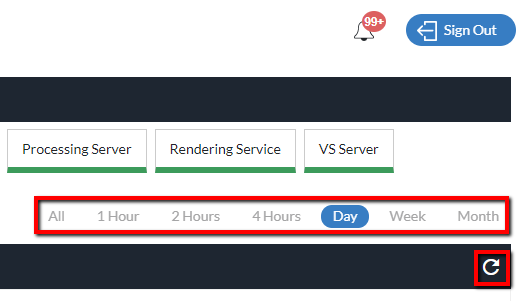
The number next to the notification icon keeps on increasing until alerts are deleted.
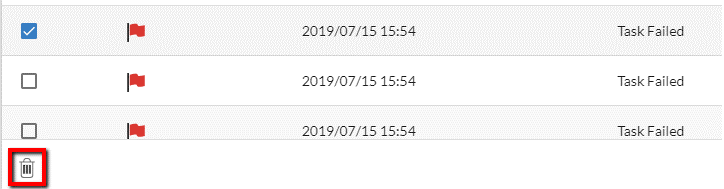
When you mark one or more events, the delete icon will appear at the bottom left of the screen. Clicking this icon will completely remove the event from the list.
Events Thresholds
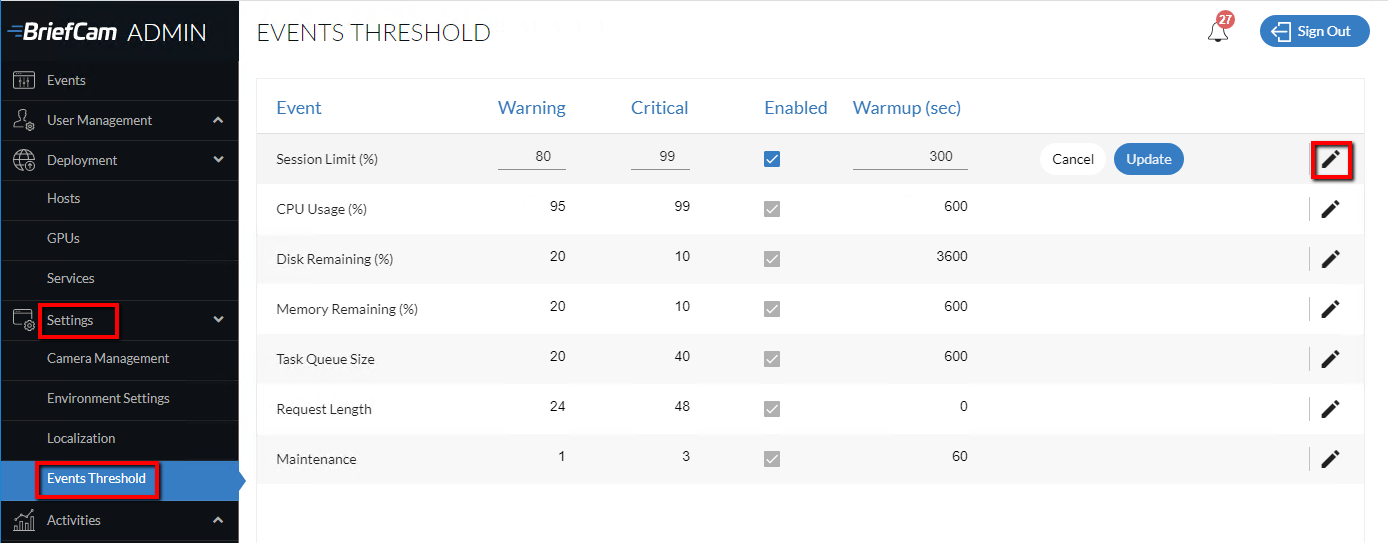
Events thresholds are set in the Settings section’s Events Threshold option. You can click the edit  icon and define the warning and critical threshold and you can enable and disable specific events that will appear in the Events section and define the Warmup period.
The Warmup (sec) column is the time to wait before triggering the event (to buffer momentary spikes).