

Managing server services
On the computer that runs server services, you find server manager tray icons in the notification area. Through these icons, you can get information about the services and perform certain tasks. This includes, for example, checking the state of the services, viewing logs or status messages, and starting and stopping the services.
Server manager tray icons (explained)
The tray icons in the table show the different states of the services running on the management server, recording server, failover recording server, and event server. They are visible on the computers with the servers installed, in the notification area:
|
Management Server Manager tray icon |
Recording Server Managertray icon |
Event Server Manager tray icon |
Failover Recording Server Manager tray icon |
Description |
|---|---|---|---|---|
|
|
|
|
|
Running
Appears when a server service is enabled and started. If the Failover Recording Server service is running, it can take over if the standard recording servers fails.
|
|
|
|
|
|
Stopped
Appears when a server service has stopped. If the Failover Recording Server service stops, it cannot take over if the standard recording server fails.
|
|
|
|
|
|
Starting
Appears when a server service is in the process of starting. Under normal circumstances, the tray icon changes after a short while to Running.
|
|
|
|
|
Stopping
Appears when a server service is in the process of stopping. Under normal circumstances, the tray icon changes after a short while to Stopped.
|
|
|
|
|
In indeterminate state
Appears when the server service is initially loaded and until the first information is received, upon which the tray icon, under normal circumstances, changes to Starting and afterwards to Running.
|
||
|
|
|
Running offline
Typically appears when the Recording Server or Failover recording service is running but the Management Server service is not.
|
||
|
|
Must be authorized by administrator
Appears when the Recording Server service is loaded for the first time. Administrators authorize the recording server through the Management Client: Expand the Servers list, select the Recording Server node and in the Overview pane, right-click the relevant recording server and select Authorize Recording Server.
|
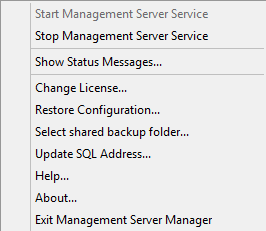
Start or stop the Management Server service
The Management Server Manager tray icon indicates the state of the Management Server service, for example Running. Through this icon, you can start or stop the Management Server service. If you stop the Management Server service, you cannot use the Management Client.
- In the notification area, right-click the Management Server Manager tray icon. A context-menu appears.
- If the service has stopped, click Start Management Server service to start it. The tray icon changes to reflect the new state.
- To stop the service, click Stop Management Server service.
For more information about the tray icons, see Server manager tray icons (explained).
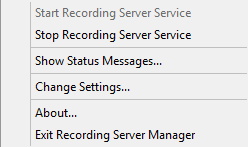
Start or stop the Recording Server service
The Recording Server Manager tray icon indicates the state of the Recording Server service, for example Running. Through this icon, you can start or stop the Recording Server service. If you stop the Recording Server service, your system cannot interact with devices connected to the server. This means you cannot view live video or record video.
- In the notification area, right-click the Recording Server Manager tray icon. A context-menu appears.
- If the service has stopped, click Start Recording Server service to start it. The tray icon changes to reflect the new state.
- To stop the service, click Stop Recording Server service.
For more information about the tray icons, see Server manager tray icons (explained).
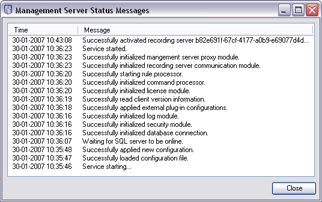
View status messages for Management Server or Recording Server
- In the notification area, right-click the relevant tray icon. A context-menu appears.
-
Select Show Status Messages. Depending on the server type, either the Management Server Status Messages or Recording Server Status Messages window appears, listing time-stamped status messages:
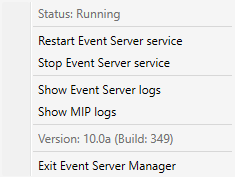
Start, stop, or restart the Event Server service
The Event Server Manager tray icon indicates the state of the Event Server service, for example Running. Through this icon, you can start, stop, or restart the Event Server service. If you stop the service, parts of the system will not work, including events and alarms. However, you can still view and record video. For more information, see Stopping the Event Server service.
- In the notification area, right-click the Event Server Manager tray icon. A context-menu appears.
- If the service has stopped, click Start Event Server service to start it. The tray icon changes to reflect the new state.
- To restart or stop the service, click Restart Event Server service or Stop Event Server service.
For more information about the tray icons, see Server manager tray icons (explained).
Stopping the Event Server service
When installing MIP plug-ins in the Event Server, first you must stop the Event Server service and then, afterward, restart it. However, while the service is stopped, many areas of the VMS system will not function:
- No events or alarms are stored in the Event Server. However, system and device events still trigger actions, for example start recording
- Add-on products do not work in XProtect Smart Client and cannot be configured from the Management Client.
- Analytic events do not work
- Generic events do not work
- No alarms are triggered
- In XProtect Smart Client, map view items, alarm list view items, and the Alarm Manager workspace do not work
- MIP plug-ins in the Event Server cannot run
- MIP plug-ins in Management Client and XProtect Smart Client do not work correctly
View Event Server or MIP logs
You can view time-stamped information about Event Server activities in the Event Server log. Information about third party integrations is logged in the MIP log in a sub-folder in the Event Server folder.
- In the notification area, right-click the Event Server Manager tray icon. A context-menu appears.
- To view the 100 most recent lines in the Event Server log, click Show Event Server Logs. A log viewer appears.
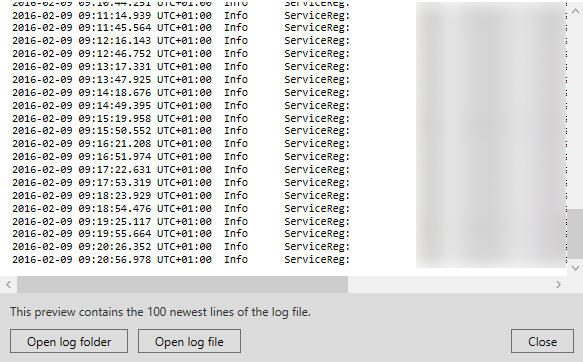
- To view the log file, click Open log file.
- To open the log folder, click Open log folder.
- To view the 100 most recent lines in the MIP log, go back to the context-menu and click Show MIP logs. A log viewer is displayed.
If someone removes the log files from the log directory, the menu items are grayed out. To open the log viewer, first you need to copy the log files back into one of these folders: C:\ProgramData\Milestone\XProtect Event Server\logs or C:\ProgramData\Milestone\XProtect Event Server\logs\MIPLogs.
Was this article helpful?
Thanks for your feedback!